


Guessing is not a strategy: How to build decision velocity with AI and real-time data
June 10, 2026 | Live Webinar

Who really owns the project budget? Clarifying financial accountability
How to learn AI the sensible way
Making sense of project cost reports
How real PM mentoring actually works
The Accidental Product Manager: What project managers need to know
accounting, agile, ai, appraisals, Artificial Intelligence, audit, Backlog, Benchmarking, benefits, Benefits Management, Benefits Realization, Bias, books, budget, Business Case, business case, business case, Career Development, Career Development, carnival, case study, Change Management, checklist, collaboration tools, communication, Communications Management, competition, complex projects, Conferences, config management, consultancy, contingency, contracts, corporate finance, corporate finance, cost, Cost Management, cost management, credit crunch, CRM, data, data security, debate, Decision Making, delegating, digite, earned value, Education, Energy and Utilities, Estimating, events, FAQ, financial management, financial management, forecasting, future, GDPR, general, Goals, Governance, green, Information Technology, Innovation, insurance, interviews, it, Knowledge Management, Leadership, Lessons Learned, measuring performance, Mentoring, merger, methods, metrics, multiple projects, negotiating, Networking, news, Olympics, organization, Organizational Culture, outsourcing, personal finance, Planning, pmi, PMO, PMO, Portfolio Management, portfolio management, presentations, privacy policy, process, procurement, product management, productivity, Program Management, project closure, project data, project delivery, Project Success, project testing, prototyping, qualifications, Quality, quality, Quarterly Review, records, recruitment, reports, requirements, research, resilience, Resource Management, resources, risk, Risk Management, ROI, salaries, Schedule Management, Scheduling, scope, Scope Management, security, small projects, Social Impact, social impact, social media, software, software, software, Stakeholder Management, stakeholders, Strategy, success factors, supplier management, team, Teams, testing, testing, timesheets, tips, training, transparency, trends, value management, vendors, video, virtual teams, workflow


| Over the last few weeks I’ve looked at why continuous improvement matters in project management, how we create the right culture for it and what tools we’ve got available to do it (lots, fortunately). Now, I want to look at how you can check to see if those improvement opportunities are having the effect you expected. Again, we have project management tools and techniques readily available for this because we have methods for benefits realisation and tracking. And those are the kind of things you can draw on for tracking. But first, we have to start off with some metrics.
What metrics are you going to use?All benefits tracking relies on having something to track against, so when you are planning your improvement initiatives, it’s important to think about what you are going to use to track. How will you know if the change has been successful? In reality, some of the changes are going to be small and you wouldn’t track them. For example, I removed a section of a template that was no longer relevant – I’m not going to set up tracking to establish whether or not that was worth it. It was worth it. If in the future we decide we want it back in (we won’t), we can add it back in. But there are other changes where it is worth measuring the impact, especially if you have to justify the change in some way. For example, if you need investment to make the change (like a change to your software tool or to pull chargeable resource off a chargeable project to do an internal change) then you’ll want to track. You could look for: Process efficiency metrics: Track changes in key process metrics, such as time to completion, resource usage, and cost savings. Ideally, you would want to see a reduction in time or cost per task. So you have to have ways to track that today, and not be implementing anything else at the same time that would also affect the metric. Quality improvements: Measure the improvement in project deliverables, such as defect rates or rework levels. You’re looking for a decrease in errors or bugs. For example, if you’ve implemented improvements to software testing or pair programming. Team engagement: If you have employee satisfaction surveys you could use those results. Or you could look at team retention rates, or the number of improvement suggestions submitted by team members as an indicator of engagement with the continuous improvement process. However, a lot of factors influence engagement, so it’s hard to say with confidence that it’s the changes that have been made that have had a significant (or any) impact on engagement and morale. Also, the impact diminishes over time. While people might start out thinking the change is amazing, over time it just becomes ‘the way we do things around here’ and people start to take it for granted. Assessing the impactYou’ll need to find a way to track performance before and after. Alternatively, consider benchmarking against other organisations. I’d only suggest doing this if you already have access to the information. When we’ve run a benchmarking exercise, it’s been expensive and I’m not sure it gave us the level of detail that would help with project management continuous improvement. So I personally wouldn’t be recommending that we invest in benchmarking unless it was for something bigger, like an assessment of PMO maturity against industry competitors. Anyway, I digress. Qualitative measuresIt’s also OK to go for qualitative measures like stakeholder feedback. Ask if they think your improvements have made a difference. However, it also might be positive if they haven’t noticed a difference. That means your change has gone in so smoothly that it is transparent to stakeholders, and that might be a good thing! Be sure to ask the team as well. Continuous feedback loops are useful, and basically that just means talking to people about how the change has impacted them and listening to their feedback. I’m enjoying writing about continuous improvement, and next time I’m going to cover some of the challenges that you might face while trying to make project management process improvements, with perhaps a few tips on how to overcome those. See you then! |
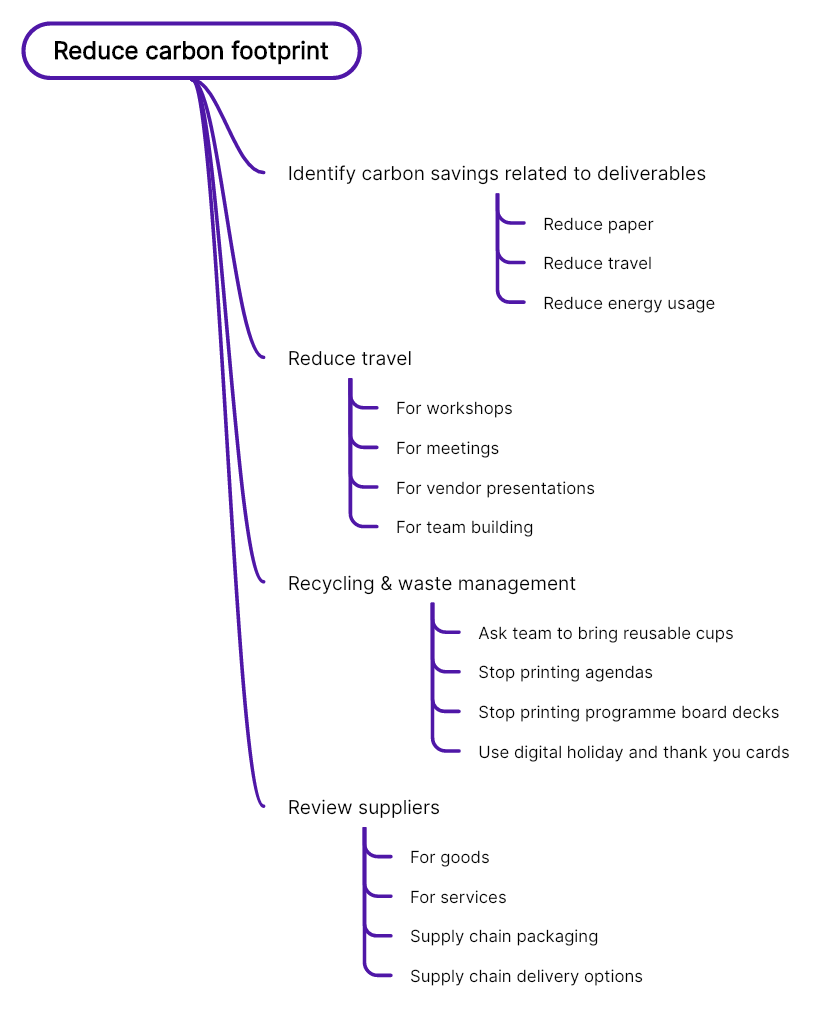
| In December I looked at how to reduce your project’s carbon footprint and provided a few ideas you could take into consideration when you’re working on a project. One of the questions I got asked on that article was how have I seen these sustainability practices implemented effectively in projects? Sustainability practices are easier to implement if there is corporate-wide mandated practices and the expectation that you will manage your project and create products in a sustainable way, but let me share a little of my experience.
Carbon savingsWhen working out project benefits, include carbon saving as one of the metrics you will track, as long as your project does something that will reduce carbon. This could be by digitalizing a process so less paper is used, removing paper cups from coffee machines and replacing them with a ‘bring your own reusable cup’ policy in your project office or something else. I’m aware that digital solutions also have a carbon footprint in that they use energy and land as there are vast data centres behind the scenes of every virtual meeting, so you’ll have to draw your own conclusions about whether the savings you are claiming are ‘real’ or not. Many companies are now very much focused on energy saving and the equivalent carbon saving this equates to, so someone in your organization is likely to be able to tell you what measures are used in the business to track and report on carbon usage. Talk to your energy manager or the sustainability team if you have one, or someone in Finance who could help you work out what, if any, carbon savings you can reasonably track. Ideally, the project’s deliverables would have a benefit that demonstrates carbon reduction, but if not, you could look to track carbon usage related to managing the project itself, for example, you could track number of journeys that did not happen because you chose to meet virtually instead. Paper usage and waste recyclingA very small thing you can do on your project is to make sure that the team does not use excessive paper. Stop printing project board decks and meeting agendas. Make these available on digital solutions instead. Use digital thank you cards instead of real ones (although you’ll have to weigh up the value in a digital one – some how for me, a physical card feels like it means more). TravelI mentioned avoiding meetings where the journey would create a carbon emission – see how much travel it is possible to cut out of your project. There’s probably some. Supply chainEven if your project is not buying anything in terms of goods, there are probably some items that you end up procuring, for example, lunches for workshops. Choose local suppliers using locally-sourced products. Ask questions of your suppliers and see if there are choices to be made. Document your decisionsThe easiest way to make sure that you are living your goals and managing to make a carbon impact is to ensure your project management plan and documentation includes the commitment. Put your metrics in your benefits tracker. Put targets in the quality plan. Make sure your schedule includes any specific actions you are going to do as a team. What other suggestions do you have for reducing your carbon footprint as a project team? Let us know in the comments section below! |
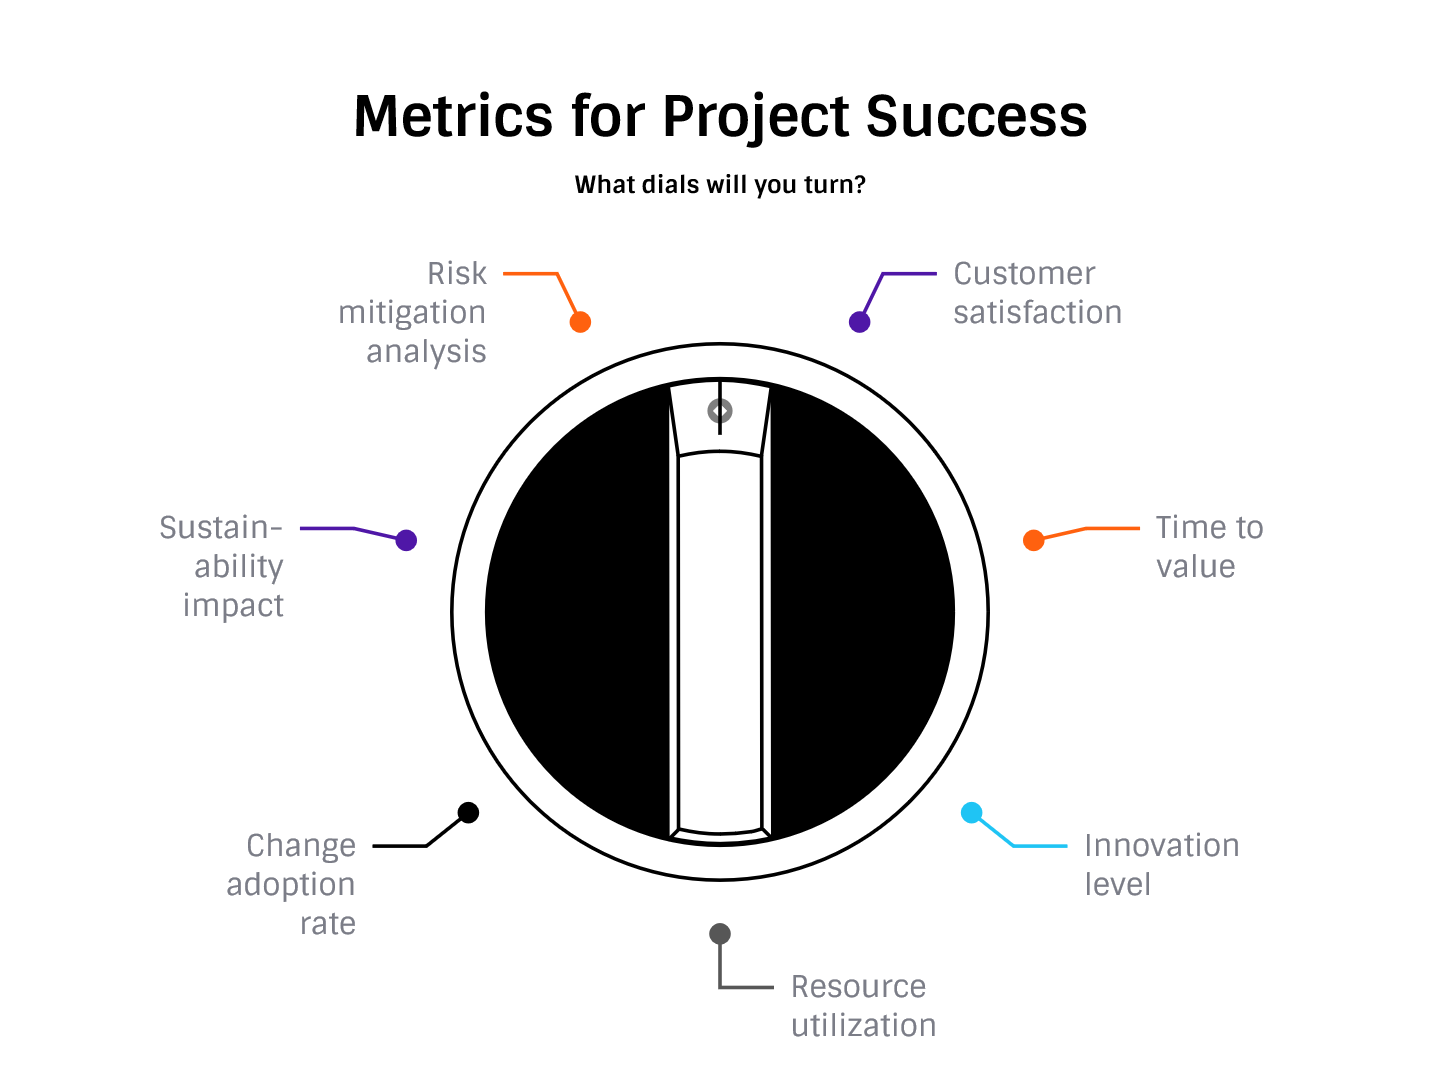
| Last month I looked at a range of alternative metrics for assessing success. One of the comments on that article asked how, on reflection, had I seen these or other alternative metrics implemented effectively. It also asked whether there were challenges that might arise integrating alternative metrics into existing project management frameworks (which I’ll look at in a different article). So, if you want to implement a more nuanced approach to measuring project success, how do you put this into practice? Below are some ideas. This topic is one that we could probably speak (or write) about at length, but hopefully the examples and ideas I share will give you some starting points for incorporating a range of measures into your project management practice.
This is an area where I have quite a lot of examples to share. In my book, Customer-Centric Project Management, my co-author and I describe an extensive exercise to set up customer satisfaction tracking on projects, with internal customers. I’ve written about customer satisfaction measurement on this blog before (start with this article: Lessons about project metrics). Basically, find out what is important to people, then track that regularly and plot your scores as part of regular reviews. You don’t have to use an ‘official’ CSAT mechanism, or pay for electronic survey tools. Just ask people as a minimum.
I haven’t used an innovation score regularly throughout a project, but it has been included in the way we rate projects and prioritize which ones should be done as the requests come into the pipeline. Implement an innovation score yourself on a simple Likert scale (1-5 or similar). Ideally, you don’t want the measure to be subjective, so set some criteria e.g.:
Or similar – you really only need a couple of measures to make up your innovation score. Use the innovation score as part of the decision criteria for whether a project should be taken forward or not.
Resource utilization reports are something I’ve only actively used on a couple of projects, because mostly we either haven’t had the tools to extract the data (because we aren’t doing timesheets or detailed estimates), or because staff have been 100% assigned to the project so we don’t have to worry about them splitting their time across projects. We would still have to worry about them being scheduled to do too many tasks in a week and being over booked, or under utilized, but when the team is full time somehow that’s easier to manage as you can see what they are doing and we speak every day. Use the reports to check exactly that: is the team going to struggle to meet its commitments? And if it is, because staff are over-scheduled, what are you going to do about it? Even the basic reports from Microsoft Project will give you utilization data, so take a look at what you already have within your tool suite and if you find it useful, use it.
The final one I’m going to talk about today is tracking risk mitigation effectiveness. I mentioned in the article that you could use AI-powered insights to establish the effectiveness of the risk management activities undertaken, but in reality I imagine that takes quite a lot of effort to set up. Another way to do this would be at project closure, or during lessons learned conversations, whenever these take place in your project lifecycle. Look at what the risk was and what was done to mitigate it. Score the risk based on the effectiveness of the action:
Using residual risk (and specifically, a financial value of residual risk) is a way to establish how effective your management action was – or at least, it’s one way to create data that allows you to assess that. Hopefully that gives you some pointers for measuring project success through different routes, with some more concrete examples of how to get started. |
|
The sustainability agenda is something all aspects of business are thinking about, and project management is no exception. We all need to be working towards creating a more sustainable future, and making the right choices on our projects is definitely one way to do that. The first step is to make sure sustainability criteria are included in your documentation templates. You can add sustainable and carbon footprint criteria to your business case templates. Here are some suggestions for how you can consider reducing the carbon footprint on your projects. Create a benchmarkMany companies these days have teams dedicated to energy management and sustainability, so your first point of call should be to check in to see what initiatives are already underway. If your carbon efforts are going to be officially recognised, you need to use official methods of calculating the reduction, with full transparency and a robust, proven measurement process in place. Who in the team will be responsible for tracking and measuring carbon savings, and do you need any additional processes in place to make it happen? A full approach like that might be overkill – if there is no expectation of having to save carbon, you might not want to go down the route of proving that you are in a measurable, transparent way. However, you can still follow the rest of the steps to brainstorm carbon-saving ideas with the team and build in carbon-friendly ways of working. Review project tasksTake a look at the work you are going to be doing on this project. Which tasks are going to generate a carbon calculation that can be measured? What tasks are going to generate carbon and what can you do differently? Identify carbon reduction activitiesFrom the work you are doing and the tasks identified, take a look at what extra actions you could to reduce the carbon impact. For example, are you planning to print a lot of leaflets or documentation? What could be delivered via a QR code or provided in digital format? What would still need to be created in paper format for a selection of users who would not be able to access digital content? What journeys are going to be undertaken on the project? Perhaps there are some workshops that can be held virtually and training delivered online instead of in a classroom. There are many advantages to getting together in person, but you might be able to identify some elements of the project that would work remotely. You can also look at the supply chain. Can you ask whether suppliers can deliver in a more sustainable way, such as with electric vehicles, or in recyclable packaging. What would that do to the budget, if anything? Add tasks to the planAdd your carbon reduction actions to your project plan. You might need to take specific actions, you might need to be more mindful of the way in which existing tasks are delivered. Make sure each action has an identified owner. Track and monitor progress towards your goalInclude carbon data in your reporting. If you are tracking according to your organisation’s metrics, then you might have some help from specialist teams who will know how best to report the data. Otherwise, add some narrative to your reporting to allow you to share your success with others. A lot of being smart with carbon on your project is just asking yourself the question: what can we do and are we doing things in the best possible way? Being aware of the challenges and helping others see that sustainability is a focus for you is key to keeping it on the agenda and making it part of the accepted ways of working. |
| We’ve all got metrics we use to assess project success: cycle time, earned value and so on. As the year ends, maybe it’s time to look at some other measures we could use that might be a bit more… dare I say… interesting? Below, I’ve suggested 7 alternative metrics you could put in place (some easily, some would take more thought and set up) to look at what project performance really means in the round.
You might find CSAT in use across other teams. Why not implement it for project management customers too? Even if you work in-house, you will have internal customers. Trust me, they have an opinion on the project management service you provide. Why not check in with them directly and ask for it? You don’t need a formal CSAT tool. Set some survey questions and set up a form to ask stakeholders their views, and then collate the results.
Cycle time is worth knowing, but does the end of your cycle always end in value delivered? A different way of thinking about it would be time to value: how quickly the project delivers tangible value per feature, or perhaps overall. This metric comes with the added challenge of having to define value: but that could be a very useful exercise for stakeholders!
Could you create your own innovation index? There are already indices in use like the Global Innovation Index, but that’s probably overkill for our projects. Consider how innovative the product/deliverables are and the method used to implement them.
Here’s one you can probably get from your project management software but I don’t see it on reports very often. What could you take from a utilization report? Metrics are only helpful if there is something you can use them for, like decision support. In this case, it would be making sure the team is adequately resourced, so you really want to be looking forward not backward. Although historical data is useful too to see if there is a trend towards over or under staffing.
Could you create a metric that looks at how quickly the organization is adopting new changes? If you work with a change manager, they might have some ideas about how to implement this. Any new process changes or anything that requires training could be included, even if your measure was only based on smiley faces!
Your procurement team might already have a sustainability index based on their work with vendors and a sustainable supply chain. If you have an energy team, they might have measures you can pull into your projects too. For example, how much carbon saving your project is creating, or how much waste is recycled from different locations.
We mitigate risks, but are those actions really useful? We could draw on AI-powered insights by plugging in risk mitigation activities across a selection of risks and the outcomes. (Or you could work through this manually). I’m not sure how you’d assess the usefulness of the mitigation strategy: maybe on a scale of 1-5? Then you could see which actions had the biggest impact in reducing the risk. There are lots of ways to measure project performance, and no one wants to be creating reports and tracking metrics for the sake of it. However, it might be worth looking at whether your current suite of metrics truly give you the complete, holistic picture of performance, because we all know it goes beyond time, cost and quality. |
|
"I'm sick and tired of hearing things from uptight, short-sighted, narrow-minded hypocrites. All I want is the truth. Just gimme some truth." - John Lennon |