The Art of Guesstimation: Estimates are Probability Distributions
From the Disciplined Agile Applied Blog
by Scott Ambler

This blog explores pragmatic agile and lean strategies for enterprise-class contexts.
Recent Posts
Data Technical Debt: 2022 Data Quality Survey Results
Is Technical Debt A Management Problem? Survey Says...
You Think Your Staff Wants to Go Back to the Office? Think Again.
Contracts, Procurement, Vendors, and Agile
Disciplined Agile 5.4 Released
Categories
#AgileBeyondIT,
#ChoiceIsGood,
ACP,
agile,
Agile Alliance,
agile-manifesto,
book,
Business Agility,
Certification,
Choose your WoW,
Conference,
Context,
Continuous Improvement,
contracts,
COVID-19,
Data Management,
database,
DDJ,
Disciplined Agile,
Enterprise Agile,
estimation,
Fundamentals,
Governance,
GQM,
guesstimation,
http://disciplinedagiledelivery.com/principles/be-awesome/,
India,
information technology,
Introduction,
Kanban,
lean,
MANAGEIndia,
math,
MENA,
Metrics,
mindset,
News,
OKRs,
Organization,
People Management,
Planning,
PMO,
Portfolio Management,
Principle,
Project Management,
Quality,
Ranged Estimates,
Remote Work,
Scrum,
Security,
skill,
software,
Surveys,
Technical Debt,
Technical debt,
Terminology,
Transformation,
value stream,
vendor management,
VMO
Date
Estimation is an important skill required by many professionals. My experience is that there are three distinct levels of how people think of estimates. My goal is to focus on the third level, estimates as probability distributions, in this blog.
Let’s begin with a quick overview of the three estimation mindset levels:
- Estimates as point-specific numbers. For example, a point-specific estimate would be that this is a million-dollar project that will take six months to complete. In the case both the cost and time estimates are fixed, scalar numbers. This mindset often stems from a desire to have an “exact number” on which to base decisions.
- Estimates as ranges. An example of a ranged estimate is that this project will cost between $800,000 and $1.4 million and take between 4 and 10 months to complete. In fact, PMI’s Practice Standard for Project Estimating (2nd Edition) suggests that a project in the start-up phase, what Disciplined Agile (DA) calls Inception, may have a rough order-of-magnitude (ROM) guesstimate of -25% to +75%. On software projects, Barry Boehm has found that -75% to +300% occurs in practice (see Software Engineering: Barry W. Boehm's Lifetime Contributions to Software Development, Management, and Research). Yikes. This estimation mindset often stems from discovering that “exact” estimates often prove to be unrealistic in practice and as a result they need to be more flexible in practice.
- Estimates as probability distributions. This is an evolution of ranged estimates in that it reflects the observation that there is a chance that a project will come in below budget (or early) and that there is a chance that a project will come in over budget (or late). This is a strategy that I first learned from Murray Cantor, author of Software Leadership, when I worked with him at IBM Rational. This estimation mindset tends to be held by people with a strong background in mathematics, in particular statistics.
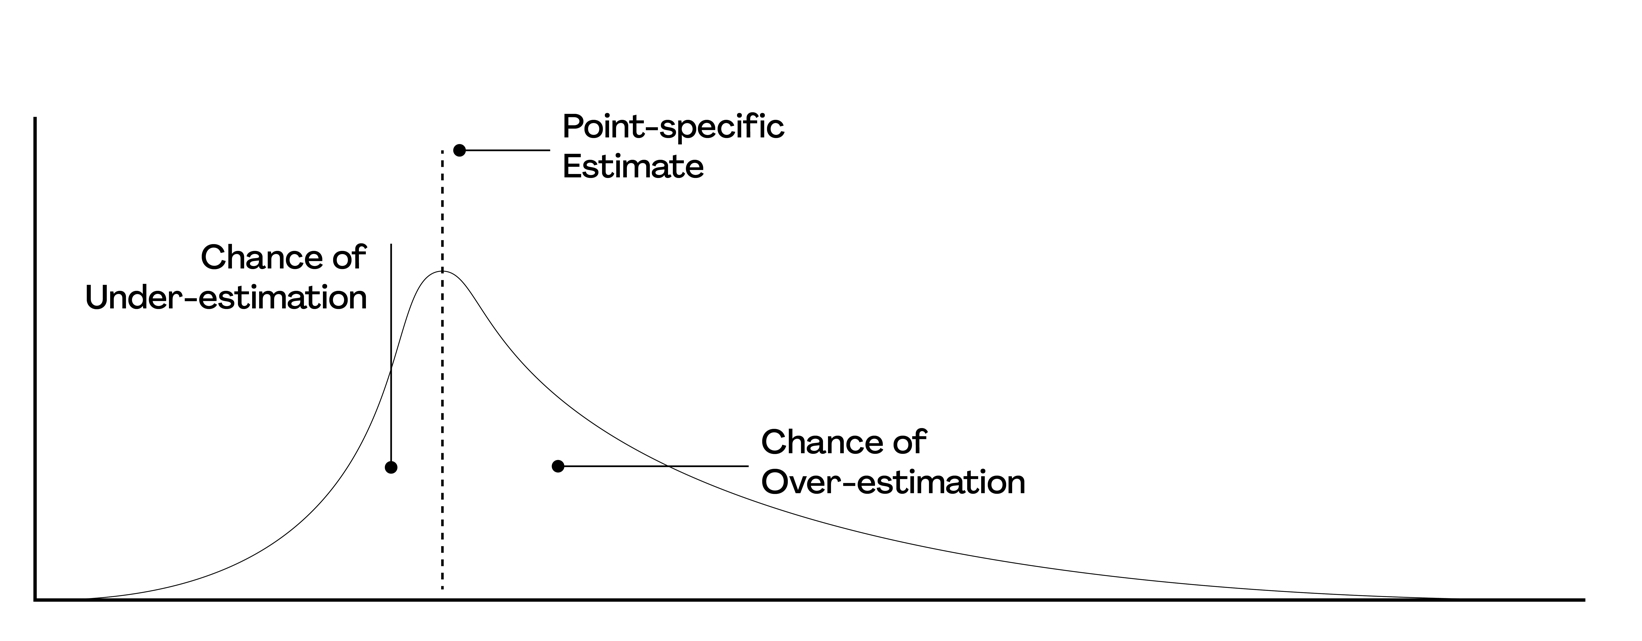
Figure 1 depicts an estimate as a probability distribution. It shows a point-specific/fixed estimate, such as $1 million, which is aligned with the peak of the curve. The area under the graph to the left of the fixed estimate point is the chance that the project will come in under budget and the area to the right is the chance that the estimate will come in over budget. This probability curve would be determined from past history of previous projects within your organization. The curve in Figure 1 is “positively skewed” in that there is more area to the right of the curve’s peak than to the left. The implication is that there is a greater chance of the project being over budget than there is of it being under budget.
Figure 1. Estimates as probability distributions.
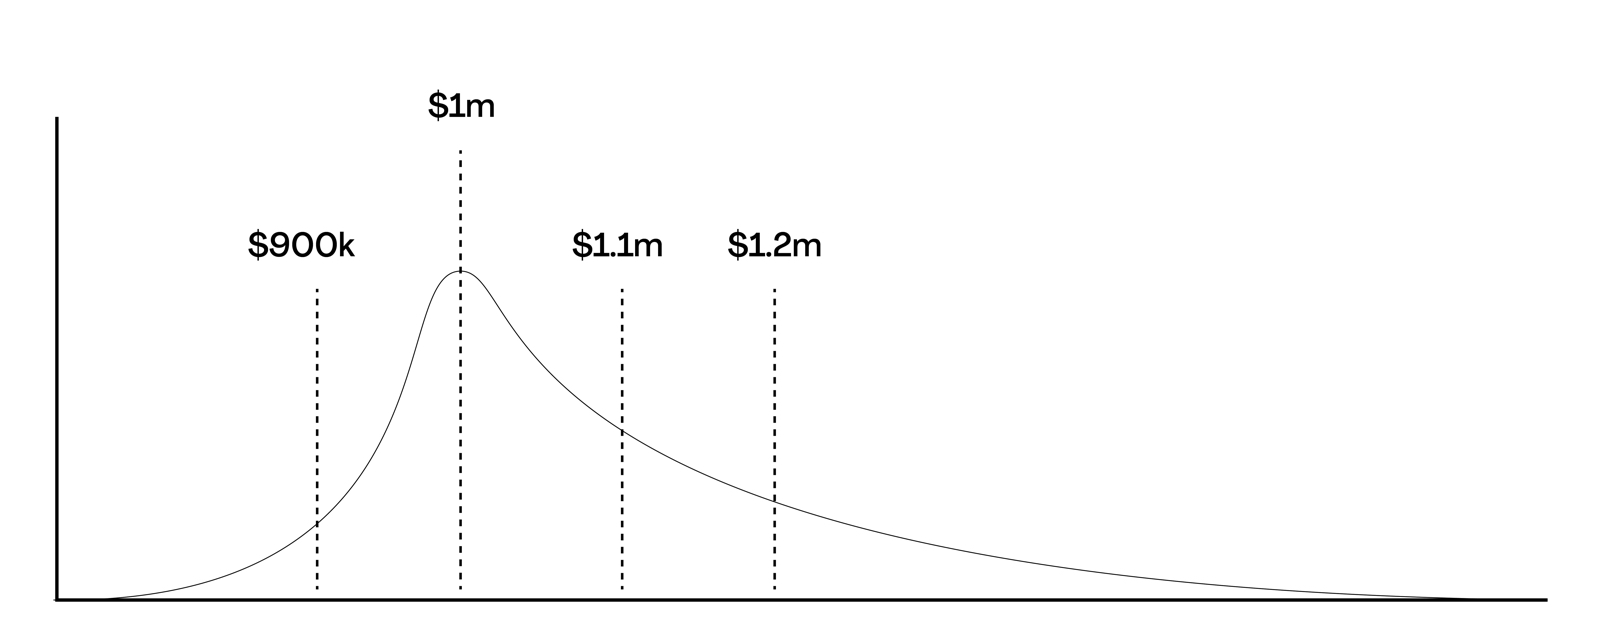
Let’s work through how you actually apply this knowledge in practice. Figure 2 shows an estimate distribution for a fictional project where we are quoting estimates in terms of probabilities. For example, the chance that this project will come in at $900K or less is the area under the graph to the left of that line, in this case it looks like it’s about 8%. The chance that it will come in at $1M or less looks to be about 22%, $1.1M or less about 45%, and $1.2M or less about 65%. The implication is that depending on the level of certainty your stakeholders require you can use this graph to provide an estimate that meets their need. If your stakeholders wanted 95% surety, for example, then you’d find the point on the estimate distribution where 95% of the area is to the left of the line, in this case it looks like it would be around $1.5 or $1.6 million. This would be a lot easier, of course, if you were using software to come up with these sorts of numbers rather simply "eye-balling" a graph. Once again, all of these numbers are based on the past history of previous projects within your organization.
Figure 2. Quoting estimates as probabilities.
There are several challenges with the concept that estimates are probability distributions:
- Many people don’t understand the concept of probability. For example, I just opened the weather app on my phone and it says that there is a 70% of snow this hour. So, if it doesn’t snow in the next hour is the app right or wrong? It’s right, because there was a 30% chance that it wouldn’t snow. But what if the app said there was a 90% chance that it will snow, but then it doesn’t? The app was still right. The point is that many people will hear a probability such as 70% or 90% and assume that it’s a certainty (100%). Conversely, they’ll hear that there is a low probability of an event and then assume that it won’t happen and won’t be prepared if it does.
- People who desire “predictability” don’t like this idea. There are still people who prefer the “certainty” of a point-specific estimate, or at least an estimate with a very tight range. While these expectations might be reasonable on straightforward projects they certainly aren’t on projects where stakeholder needs or implementation strategies evolve constantly (as is typical on software projects, for example).
- Estimates don’t follow a normal bell curve distribution. As I indicated earlier, estimates tend to follow a positively skewed distribution. This is the result of overly-optimistic estimation or pressure to produce an estimate that is palatable to decision makers. This positive skewing can be frustrating for many people because the implication is that you’re more likely to be over budget or late than you are to be under budget or early respectfully.
In the next blog in this series we’ll work through the strategy of ranged estimates in greater detail.
Posted on: March 02, 2020 11:10 AM |
Permalink
Comments (13)
Please login or join to subscribe to this item

Skip Pletcher
Dir, Engineering| Revalizae Inc
Jacksonville, Fl, United States
At a prior org, we switched from being 80% optimistic to 80% pessimistic by using story points which included risk/uncertainty and complexity in addition to effort. We used 60% of sprint capacity as a strategy for projecting allocation. We were just as wrong but in the other direction, so wound up turning in cap dollars instead of asking for more. We tried sharing cone of uncertainty around our velocity guesses, and folks just didn�t �get it

Scott Ambler
Consulting Methodologist| Ambysoft Inc.
Toronto, Ontario, Canada
The key issue is to learn from this experience and improve your approach. Try something, assess its effectiveness, adopt if it works and evolve it if it doesn't.
As for cone of uncertainty, it all depends on how you communicate it. I've got an upcoming collection of blogs on this.
Thanks for the refresher, Scott!
Monte Carlo simulation tools such as @Risk provide a good way to put probability distributions to good use by providing stakeholders with date/cost targets which are at varying levels of confidence.

Al Taylor
I.T. Contractor| Independent
Waterloo, Ontario, Canada
Good discussion Scott.
Could there be a 4th challenge be related to 'past history of projects' ?....Do we look into the past often enough? Do we persist enough history to account for people coming and going?
Scott Ambler
Consulting Methodologist| Ambysoft Inc.
Toronto, Ontario, Canada
Al, you're right, looking to the past is a struggle for a lot of organizations. This is the case for several reasons:
- Few organizations accurately track their projects and their key aspects
- You may not have a sufficient history to have a statistically significant set of data (yet)
- The nature of your organization and projects likely vary faster than you can build up such a data set anyway

Eduard Hernandez
 Community Champion
Corporate Project Manager - Tech Transfer| Neuraxpharm
Barcelona, Cataluña, Spain
Good article, Scott.
Looking at Figure 1 I thought of a graphic that plots the probability Vs duration estimates used during project scheduling and the student syndrome. In order to have an e.g. 99% certainty that an activity is finished by "x" amount of days, a significant buffer is added, at the risk of suffering from the student syndrome (buffers will be used for procastrination).

William Davis
Senior Project Manager| NCCI Holdings Inc
Boca Raton, Fl, United States
Great article, Scott! I've written on this topic, too, and I've got a couple deliverables available on this site that helps people model uncertainties using probabilities (sorry, these comments don't allow clickable links so you'll have to copy/paste). Here's a deliverable that uses the beta distribution functions in Excel: https://www.projectmanagement.com/deliverables/370547/Statistical-PERT--Beta-Edition And here's the normal distribution (which, as Scott points out, may not be the best-fitting distribution for some uncertainties, but in practical use, may be "good enough" to align expectations and make good decisions): https://www.projectmanagement.com/deliverables/303623/Statistical-PERT---SPERT---Estimation-Worksheet Here's an article I wrote: https://www.projectmanagement.com/articles/370549/Getting-Beta-with-Statistical-PERT
Scott Ambler
Consulting Methodologist| Ambysoft Inc.
Toronto, Ontario, Canada
Eduard, yes, there are always side effects of any decision. The greater the certainty you want the greater the chance people will leave the work to the last minute. One of the unfortunate side effects of estimation.

Gerry Mackenzie
Scrum Master and Agile & Digital Project manager| Consultant Scrum Master
Cremorne, New South Wales, Australia
Great article and comments. Is there some way that the coloured icons against Scott's title, can be formatted to appear in another place rather than the middle of the comments which hinders reading?
cheers
Scott Ambler
Consulting Methodologist| Ambysoft Inc.
Toronto, Ontario, Canada
Gerry, which icons are you referring to?
Having asked that, I suspect it will be an HTML rendering issue. I'm viewing this article on a Mac in Safari and it's ok. Safari typically isn't as well supported as Chrome or the MS browser.

Robin Goldsmith
President| Go Pro Management Inc.
Needham, Ma, United States
Scott, I agree and actually teach using probability distributions in estimating. That said, I also tell my clients and students about several critical considerations that need to be taken into account but too seldom are.
Range estimates are what I call �conventional we�s dumb.� Many supposed authorities blindly advocate ranges with the best of intentions, and their disciples even more blindly adopt the advice. In fact, ranges almost always are a trap that actually creates failure. Chances are the range variances are arbitrary (e.g., /- 50%) rather than based on the project characteristics that cause actuals to go over or under the estimate. Worse, the estimator hears the maximum; the victim (customer, boss, etc.) hears the minimum.
Historical data indeed is essential but too often is not a reliable basis for guiding estimates. Many organizations simply don�t have relevant data, even though they could. People instead rely on their own recollections which invariably are grossly distorted to fit their desired views of how things went. Most organizations never compare actual to expected results. If they look back at all, they often rationalize results to fit their desired views.
Moreover, even when supportable historical numbers do exist, they all need to reflect the results of reasonably similar processes which in turn will be followed in the project being estimated. While some organizations do carry out many similar projects that provide reasonable bases for projections (e.g., dentists can reliably predict how long a filling takes vs. a cleaning; auto repair shops know precisely how long it take to change oil vs. do a tune-up, etc.), most organizations are likely to have relatively few distinct explicitly-repeated types of projects and thus tend to create historical data which lumps together all sorts of unlike projects/processes.
Distributions hold up so long as people stay focused on an original target. For example, if they expect to finish in 100 hours, plus or minus three 20-hour standard deviations (assuming they are based on reasonable historical data) usually will hold up. One then sets a schedule of 150 hours to have say 85% probability of success, which will come true so long as the team stays focused on finishing in 100 hours. However, in reality, the team shifts focus to finishing in 150 hours, which now becomes the midpoint of the distribution which actually occurs�and at least 200 hours is probably what it will take.
Scott Ambler
Consulting Methodologist| Ambysoft Inc.
Toronto, Ontario, Canada
Robin, great points and frankly you're stealing some of my thunder from the next blog in this series which goes into those issues around ranged estimates.
Scott Ambler
Consulting Methodologist| Ambysoft Inc.
Toronto, Ontario, Canada
Robin, great points and frankly you're stealing some of my thunder from the next blog in this series which goes into those issues around ranged estimates.
Please Login/Register to leave a comment.
|
"Don't go around saying the world owes you a living. The world owes you nothing. It was here first."
- Mark Twain
|


