


A common practice is to present estimates in terms of ranges, such as $500K to $900K, rather than point-specific scalars such $650K. The size of the range that you provide reflects the quality of your understanding of what you’re estimating. PMI’s Practice Standard for Project Estimating (2nd Edition) suggests an initial guesstimate of -25% to +75%, in general, on projects. We want to present our estimates in ranges so as to set realistic expectations with our stakeholders.
Your mileage may vary, sometimes dramatically. Barry Boehm, one of the most respected researchers in the software engineering world, has found that a range of -75% to +300% occurs in practice on software projects (see Software Engineering: Barry W. Boehm's Lifetime Contributions to Software Development, Management, and Research). The initial range is so large because our stakeholders often don’t know what they want, or can’t agree on what they want, and thus it makes it very difficult to estimate. As Boehm shows this problem is particularly acute in the software world due to the flexibility of software, expectations around software, and the unfortunate tendency of software professionals to agree to requested changes (and then delivering on those promises in sometimes questionable manners). Marc Bastien presents an insightful exploration of these challenges in his recent book Understanding the Corporate IT Strategy Game.
Figure 1 is based on an actual software development project taking a “predictive” serial approach where the original estimate of 10 months was based on an up-front function point (FP) count. This is depicted by the first line in Figure 1, as a point-specific scalar estimate. But as we know estimates are probability distributions and should therefore be presented as a range. The second line in Figure 1 shows the initial estimate as a probability distribution. Although it appears to have a large range, which can be disconcerting to anyone hoping for a scalar estimate, this team was able to tighten the range to be 9 to 13 months due to the significant investment they made in function point counting. Over time, as our understanding improves and the uncertainty shrinks the range of the estimate also shrinks.
Figure 1. Ranged estimates will narrow over time on a healthy project.

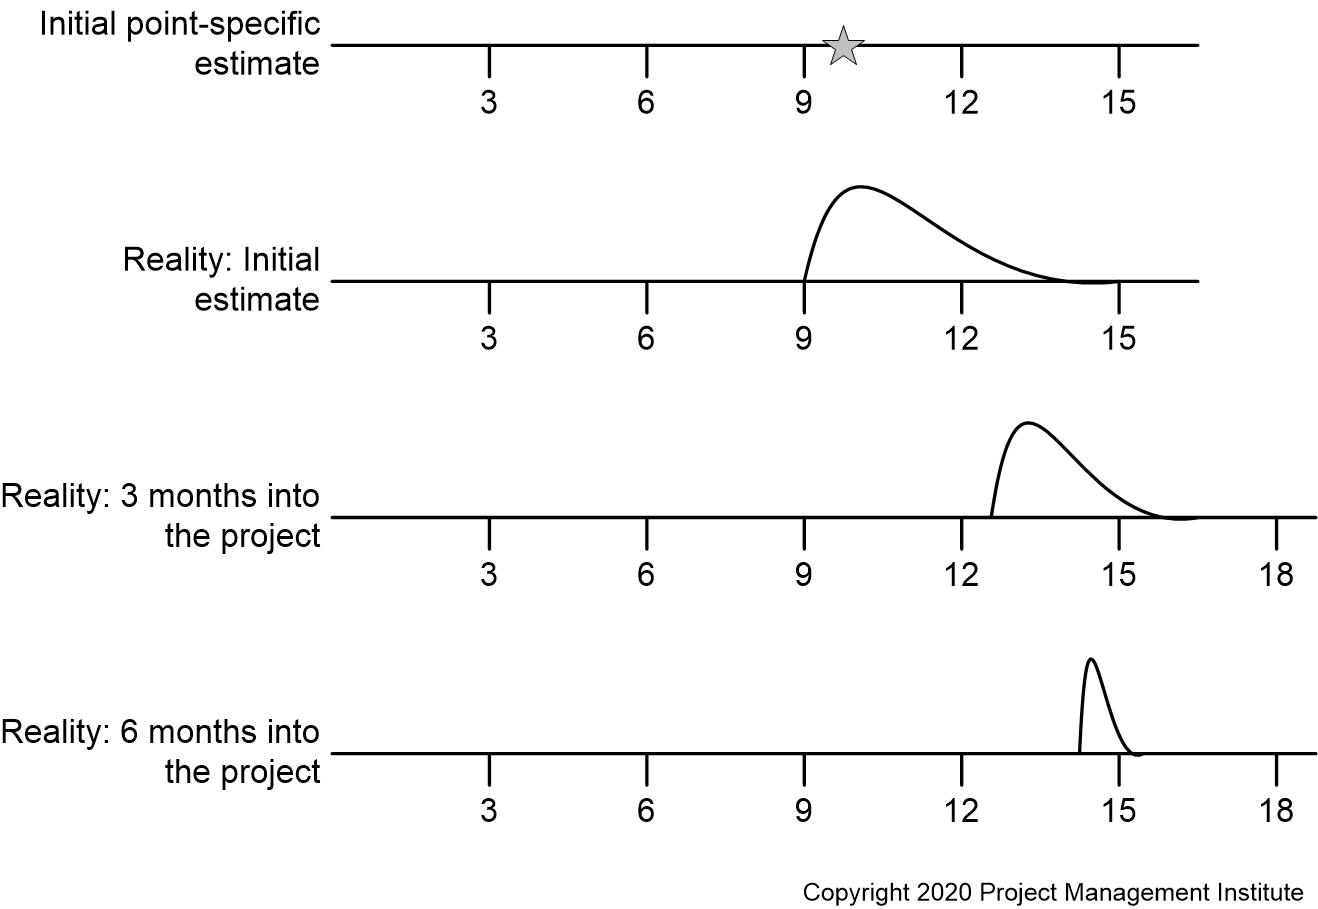
An interesting aspect of Figure 1 is that after 3 months you can see that the range of the estimate has tightened a bit and has shifted to the right (the project is likely to take longer than originally believed). Notice how I said likely to take longer and not going to take longer – that’s because estimates are probability distributions and not certitudes, so I choose to be careful with my language and not imply that the estimate is precise. Similarly, at the six month point we’re seeing a much narrower range, that’s because we have a much better understanding of both the problem we’re hoping to solve and the solution that we’re implementing to do so. Figure 1 indicates that the likely project delivery date is clearly slipping over time, with a peak of about 10 months, 13.5 months, and 14.5 months respectively. Needless to say the project manager had a few testy conversations with the project stakeholders throughout this period. In the end this team delivered at the 16 month point and then had a second release 6 months later to address quality problems and dropped scope as the result of the “rush job” required to release after 16 months. So the 10 month project took 22 months in practice.
Tracking Ranged Estimates Over Time
An estimation trend chart, see Figure 2, is a useful way to depict ranged estimates over time. This diagram corresponds to what we saw in Figure 1, albeit with monthly rather than quarterly estimates. The vertical bars represent the ranged estimate each month and the dashed lines are the smoothed trend lines for high and low ends of the ranges. These two lines indicate what is called the “cone of uncertainty,” an indication of relative risk surrounding the precision of your estimates over time. On a healthy project the two lines will converge at the end of the project, on an unhealthy project that is trending towards failure they will not converge (more on this in a minute).
Figure 2. An estimation trend chart.
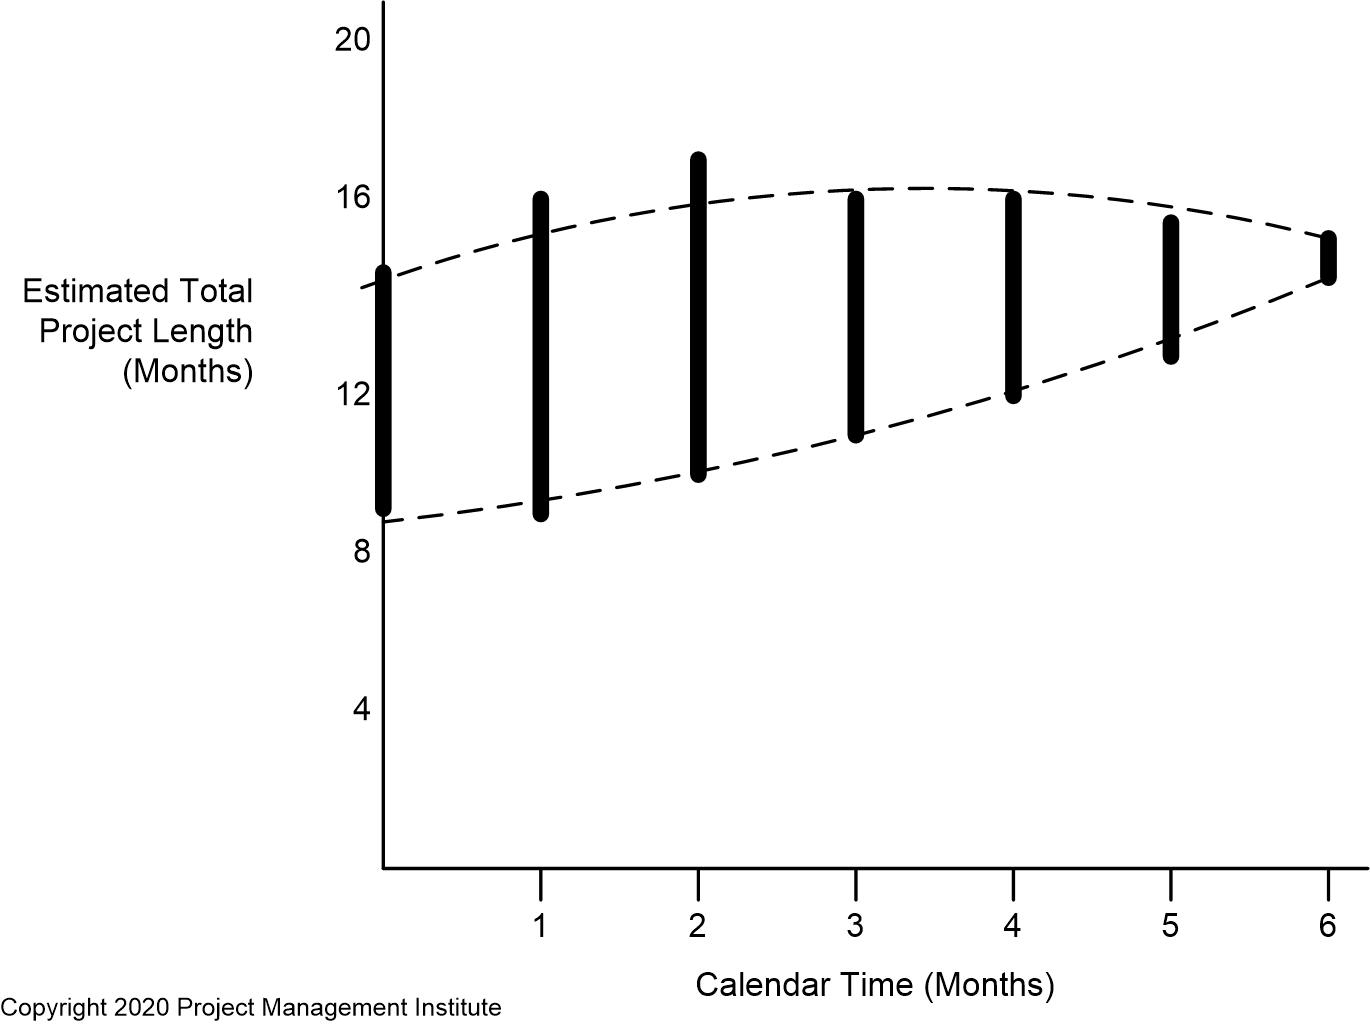

At the start of a project you will very likely begin with a guesstimate, which is an estimate with a very wide range. Over time the range narrows and your guesstimates evolve into estimates. The point at which guesstimates are considered estimates is up to your organizational culture. In the case of the project depicted in Figure 2, I suspect that was around the fourth or more likely fifth month of the timeline.
I would be remiss if I didn’t point out that if your estimation range isn’t shrinking over time then that is a sign that your project is in trouble. There are several potential causes for this to happen, including a lack of agreement amongst stakeholders as to the scope of the effort, an inappropriate solution architecture/design strategy, or challenges around how your team is formed (typically you don’t have the right people or sufficient people to get the job done). In Disciplined Agile (DA) we specifically address these common risks via the stakeholder agreement milestone, the proven architecture milestone, and explicit advice about forming teams respectively. In short, on healthy projects your ranged estimates will tighten over time and on unhealthy projects, if you’re being honest in your estimations, they very likely will not.
The fact that estimates should be presented in ranges is a critical concept for both your executives and your stakeholders to accept. If they don’t understand the implications of this, and that these ranges really represent probability distributions, then they will not be able to govern effectively. In the next blog in this series I’m going to share a collection of truisms about estimation that I believe you will find interesting.


