Extending the Agile Manifesto - 2018


|
We believe that the changes we’re suggesting are straightforward:
The original manifesto principles were crafted to reflect the environment in the ‘90s when it was an accomplishment to have a demonstrable increment of a solution even every month. In modern times the bar is significantly higher. As such, if you compare the wording of the updated principles as we describe them to the original, you will observe that they reflect a lean philosophy of a continuous, just-in-time, experimental, and emergent approach to everything we do. What we have written may be perceived as heresy to some agile religious puritans but we believe it is time to move on to reflect modern realities and capabilities. We’d love to hear your feedback. Good things to know
|

Apply Consistent Metrics Categories Across an Agile Portfolio
Categories:
agile,
agile governance,
metrics,
Scrum,
Kanban,
lean,
Portfolio Management,
Project Management,
agile metrics,
scorecard,
Governance
Categories: agile, agile governance, metrics, Scrum, Kanban, lean, Portfolio Management, Project Management, agile metrics, scorecard, Governance
|
A common question that we get from customers who are new to Disciplined Agile (DA) is how do you aggregate, or "roll up", metrics from agile teams into a portfolio dashboard? A more interesting question is how do you do this when the teams are working in different ways? Remember, DA teams choose their way of working (WoW) because Context Counts and Choice is Good. Even more interesting is the question “How do you aggregate team metrics when you still have some traditional teams as well as some agile/lean teams?” In this blog we answer these questions one at a time, in order. Note: We’re going to talk in terms of a single portfolio in this article, but the strategies we describe can apply at the program (a large team of teams) too, and then the program-level metrics are further rolled up to higher levels.
How Do You Aggregate Agile Team Metrics Into a Portfolio Dashboard?Pretty much the same way you aggregate metrics from traditional teams. There tends to be several potential challenges to doing this, challenges which non-agile teams also face:
How Do You Aggregate Agile Team Metrics Into a Portfolio Dashboard When the Teams Choose Their WoW, and it’s Different For Each Team?When a team is allowed to choose it’s way of working (WoW), or “own their own process,” the team will often choose to measure itself in a manner that is appropriate to it’s WoW. This makes a lot of sense because to improve your WoW you will want to experiment with techniques, measure their effectiveness for your team within your current context, and then adopt the techniques that work best for you. So teams will need to have metrics in place that provide them with insight into how well they are working, and because each team is unique the set of metrics they collect will vary by team. For example, in Figure 1 below we see that the Data Warehouse (DW) team has decided to collect a different sent of metrics to measure stakeholder satisfaction than the Mobile Development team. The DW team needs to determine which reports are being run by their end users, and more importantly they need to identify new reports that provide valuable information to end users – this is why they have measures for Reports run (to measure usage) and NPS (to measure satisfaction). The Mobile team on the other hand needs to attract and retain users, so they measure things like session length and time in app to determine usage, and user retention and NPS to measure satisfaction. Figure 1. Applying consistent metrics categories across disparate teams (click on it for a larger version).
Furthermore, the nature of the problem that a team faces will also motivate them to choose metrics that are appropriate for them. In Figure 1 we see that each team has a different set of quality metrics: the DW team measures data quality, the mobile team measures code quality, and the package implementation team measures user acceptance test (UAT) results. Although production incidents and automated test coverage are measured by all three teams, the remaining metrics are unique. The point is that instead of following the consistent metrics practice across teams by insisting that each team collects the same collection of metrics, it is better to ask for consistent metric categories across teams. So instead of saying “thou shalt collect metrics X, Y, and Z” we instead say “Thou shalt collect metrics that explore Category A, Category B, and Category C.” So, as you can see in Figure 1, each team is asked to collect quality metrics, time to market metrics, and stakeholder satisfaction metrics but it is left up to them what metrics they will choose to collect. The important point is that they need to collect sufficient metrics in each category to provide insight into how well the team addresses it. This enables the teams to be flexible in their approach and collect metrics that are meaningful for them, while providing the governance people within our organization the information that they need to guide the teams effectively. So how do you aggregate the metrics when they’re not consistent across teams? Each team is responsible for taking the metrics that they collect in each category and calculating a score for that category. It is likely that a team will need to work with the governance body to develop this calculation. For example, in Figure 2 we see that the each team has a unique dashboard for their team metrics, yet at the portfolio level the metrics are rolled up into a stoplight status scorecard strategy for each category (Green = Good, Yellow = Questionable, Red = Problem). Calculating a stoplight value is one approach, you could get more sophisticated and calculate a numerical score if you like. This is something the governance body would need to decide upon and then work with teams to implement. Figure 2. Rolling up metrics categories (click on it for a larger version).
From the looks of the Portfolio dashboard in Figure 2 there is a heat map indicating the overall status of the team (using green, yellow, and red again) and the size of the effort (indicated by the size of the circle). Anyone looking at the portfolio dashboard should be able to click on one of the circles or team stoplights and be taken to the dashboard for that specific team. The status value for the heatmap would be calculated consistently for each team based on the category statuses for that team – this is a calculation that the governance body would need to develop and then implement. The size of the effort would likely come from a financial reporting system or perhaps your people management systems.
How Do You Aggregate Team Metrics When Some Teams Are Still Traditional?With a consistent categories approach it doesn’t really matter what paradigm the team is following. You simply allow them to collect whatever metrics are appropriate for their situation within each category and require them to develop the calculation to roll the metrics up accordingly. If they can’t come up with a reasonable calculation then the worst case would be for the Team Lead (or Project Manager in the case of a traditional team) to manually indicate/enter the status value for each category.
Parting ThoughtsFor the consistent categories strategy to work the governance people need to be able to look at the dashboard for a team, which will have a unique collection of widgets on it, and be able to understand what the dashboard indicates. This will require some knowledge and sophistication from our governance people, which isn’t unreasonable to ask for in our opinion. Effective leaders know that metrics only provide insight but that they shouldn’t manage by the numbers. Instead they should follow the lean concept of “gemba” and go see what is happening in the team, collaborating with them to help the team understand and overcome any challenges they may face.
Related Links
|


Agile Architecture at Agile 2018
|
On August 8th I facilitated a workshop at Agile 2018 that focused on agile architecture. I promised everyone, we had over 150 people in the workshop, that I would post the pictures of their strategy canvases online so that they could have copies of it. So here’s my promised blog! How architecture fits into agile ways of working (WoW) has been an important topic from the very beginning. As with all other aspects of agile, the Disciplined Agile (DA) toolkit provides you with choices – because every team is unique and faces a unique situation, they need to choose their WoW to reflect this (we like to say that context counts). To enable teams to effectively choose their WoW they need to know what choices they have available to them (we also believe that choice is good) and what the trade-offs of those choices are (because there’s no such thing as a best practice). So in this workshop we worked through twelve agile architecture strategies. Granted, there’s a lot more than this, but we only had 75 minutes so I lead everyone through some of the key strategies. This blog overviews each strategy and then shares the strategy canvases that the class developed. Our approach was to assign each strategy to several tables and then ask each group to discuss the advantages of the strategy, the disadvantages, and when you would use it. There are pictures below of each strategy canvas – it’s important to note that I don’t agree with all of the sticky notes, but for the most part it’s solid stuff. Our upcoming book, trending to arrive in October 2018, explores these strategies (and more). During the workshop we explored three fundamental questions:
How Do You Explore Your Initial Architecture Strategy?Each group was given one of three initial architecture strategies to discuss:
No modelingAt the beginning of our project/endeavor we will perform no architecture modeling or exploration at all. We believe that all aspects of the architecture will emerge over time during Construction.
Lightweight modelingAt the beginning of our project/endeavor we will invest a bit of time, potentially several hours or even a few days, to perform some lightweight agile architecture modeling. We believe that we should think through the high-level architectural issues now but that the design details will emerge over time. Our “models” will be created using inclusive modeling tools such as whiteboards, paper or sticky notes. We’re likely to create one or more high-level sketches, each of which explores an architectural view (such as the technical architecture, the data architecture, the communications architecture, and so on).
Heavy modelingAt the beginning of our project/endeavor we will invest a fair bit of time, potentially several weeks or even a few months, to work through the architecture of our solution. We believe that we need to think through most, if not all, aspects of the architecture in detail before we can safely proceed with Construction. Our models may be either visual (i.e. UML component diagrams, Free-form architecture diagrams, Data Models, …) or textual (e.g. white papers) in nature. Our visual models will be supported by sufficient documentation to capture the details overviewed by the diagrams. Our models will be captured with software-based diagramming tools (e.g. Visio, OmniGraffle), documentation tools (e.g. Word processors or Wikis), or modeling tools (e.g. Enterprise Architect).
How Do You Bring Architecture Skills Into the Team?Each group was given one of five architecture skills/roles strategies to explore:
No architectOn our project/endeavor we do not have anyone on the team responsible for architecture work nor do we have anyone with sufficient architecture skills to do so. Luckily we are a group of smart, experienced developers and we believe that we will be able to evolve the architecture of our solution through teamwork and experimentation.
Part-time architectOn our project/endeavor we have someone on our team acting as a part-time architect. This person is very experienced and is a member of our corporate architecture team, supporting several solution delivery teams including our own. The part-time architect guides our team in architecture decisions, providing advice, educating us in any existing corporate architecture guidance, and reviewing any work that we do on our own.
Modeler architectOn our project/endeavor we have someone with deep architecture experience and skills. In the past they were a developer but over time they worked their way out of that role to become an architect. Their job is to work through the architectural strategy for the team, describe that architecture strategy to us, and develop and maintain sufficient architecture models and documentation throughout the lifecycle. Although they are technically adept and well versed in the domain, they do not have technical experience with some of the platforms and technologies that the team is likely to work with.
Developer architectOn our project/endeavor we have someone who is a full-time member of our team who has deep architecture experience as well as development skills. They are responsible for formulating the architecture strategy for the team although will often work with other team members to get their input into architecture decisions. When they are not doing architecture work they are an active developer on the team.
Architecture ownerOn our project/endeavor we have someone in the role of Architecture Owner (AO). This is a full-time team member who has architecture experience, is well versed in our corporate architecture guidance/strategies, and also has development skills. The AO:
How Do You Evolve Your Architecture?Each group was given one of four architecture evolution strategies to explore:
Architectural GuidanceOne of the approaches that our team uses to evolve our architecture is refer to our organization’s existing architectural guidance. We typically do this by talking with someone on our team familiar with that guidance, such as an Architecture Owner (AO). This person may decide to look up the current version of the architecture guidance as needed (hopefully this is captured in an agile, lightweight manner). Such architecture guidance may include:
Architecture SpikesOne of the approaches that our team uses to evolve our architecture is to run architecture spikes (or simply called spikes). Whenever we run into an architectural issue, such as how a technology works within our environment or how a combination of technologies work together, we write a bit of code to explore the issue. This is typically throwaway prototyping code because we want to quickly experiment to gather sufficient data to make a better-informed decision. Spikes typically take a few hours to a few days. A spike can be thought of as a very small proof of concept (PoC).
Walking SkeletonsOne of the approaches that our team uses to evolve our architecture is to develop a walking skeleton, also known as a working skeleton or steel frame, of our solution early in Construction. We do this by focusing on a small collection of requirements early in the lifecycle that implement sufficient functionality to address our highest-risk items so as to show that our architectural strategy works in practice. Once the walking skeleton is in place we spend the rest of Construction putting the functional flesh onto it.
Just-in-time (JIT) Model StormingOne of the approaches that our team uses to evolve our architecture is to explore requirement and design details at the last most responsible moment. We do this via light-weight agile modeling (sketching, sticky notes, …). Model storming sessions are often impromptu and last for several minutes, often starting with a request along the lines of “Hey, can you help me work through this…”.
Parting ThoughtsAfter the workshop I received a lot of great feedback from attendees. It really resonated with people and seemed to provide them with a lot of value. I was glad to hear that.
Further Reading |


Database DevOps at Agile 2018
|
On Tuesday, August 7 I facilitated a workshop about Database DevOps at the Agile 2018 conference in San Diego. I promised the group that I would write up the results here in the blog. This was an easy promise to make because I knew that we’d get some good information out of the participants and sure enough we did. The workshop was organized into three major sections:
Overview of Disciplined DevOpsWe started with a brief overview of Disciplined DevOps to set the foundation for the discussion. The workflow for Disciplined DevOps is shown below. The main message was that we need to look at the overall DevOps picture to be successful in modern enterprises, that it was more that Dev+Ops. Having said that, our focus was on Database DevOps.
Challenges around Database DevOpsWe then ran a From/To exercise where we asked people to identify what aspects of their current situation that they’d like to move away from and what they’d like to move their organization towards. The following two pictures (I’d like to thank Klaus Boedker for taking all of the following pics) show what we’d like to move from/to respectively (click on them for a larger version).
I then shared my observations about the challenges with Database DevOps, in particular the cultural impedance mismatch between developers and data professionals, the quality challenges we face regarding data, the lack of testing culture and knowledge within the data community, and the mistaken belief that it’s difficult to evolve production data source.
Techniques Supporting Database DevOpsThe heart of the workshop was to explore technical techniques that support database DevOps. I gave an overview of several Agile Data techniques so as give people an understanding of how Database DevOps works, then we ran an exercise. In the exercise each table worked through one of six techniques (there are several supporting techniques that the groups didn’t work through), exploring:
Each team was limited to their top three answers to each of those questions, and each technique was covered by several teams. Each of the following sections has a paragraph describing the technique, a picture of the Strategy Canvas the participants created, and my thoughts on what the group produced. It’s important to note that the some of the answers in the canvases contradict each other because each canvas is the amalgam of work performed by a few teams, and each of the teams may have included people completely new to the practice/strategy they were working through.
Vertical SlicingJust like you can vertically slice the functional aspects of what you’re building, and release those slices if appropriate, you can do the same for the data aspects of your solution. Many traditional data professionals don’t know how to do this, in most part because traditional data techniques are based on waterfall-style development where they’ve been told to think everything through up front in detail. The article Implementing a Data Warehouse via Vertical Slicing goes into this topic in detail.
The advantages of vertical slicing is that it enables you to get something built and into the hands of stakeholders quickly, thereby reducing the feedback cycle. The challenge with it is that you can lose sight of the bigger picture (therefore you want to do some high-level modeling during Inception to get a handle on the bigger picture). To be successful at vertically slicing your work, you need to be able to incrementally model, or better yet agilely model, and implement that functionality.
Agile Data ModelingThere’s nothing special about data modelling, you can perform it in an agile manner just like you can model other things in an agile manner. Once again, this is a critical skill to learn and can be challenging for traditional data professionals due to their culture around heavy “big design up front (BDUF)”. The article Agile Data Modelling goes into details, and more importantly an example, for how to do this.
Database RefactoringA database refactoring is a simple change to your database that improves the quality of its design without changing the semantics of the design (in a practical manner). This is a key technique because it enables you to safely evolve your database schema, just like you can safely evolve your application code. Many traditional data professionals believe that it is very difficult and risky to refactor a database, hence their penchant for heavy up-front modeling, but this isn’t actually true in practice. To understand this, see the article The Process of Database Refactoring which summarizes material from the award-winning book Refactoring Databases.
Automated Database Regression TestingIf data is a corporate asset then it should be treated as such. Having an automated regression test suite for a data source helps to ensure that the functionality and the data within a database conforms to the shared business rules and semantics for it. For more information, see the article Database Testing.
Continuous Database IntegrationDatabase changes, just like application code changes, should be brought into your continuous integration (CI) strategy. It is a bit harder to include a data source because of the data. The issue is side effects from tests – in theory a database test should put the db into a known state, do something, check to see if you get the expected results, then put the DB back into the original state. It’s that last part that’s the problem because all it takes is one test to forget to do so and there’s the potential for side effects across tests. So, a common thing is to rebuild (or restore, or a combination thereof) your dev and test data bases every so often so as to decrease the chance of this. You might choose to do this in your nightly CI run for example. For more information, see the book Recipes for Continuous Database Integration. Operational Data Monitoring An important part of Operations is to monitor the running infrastructure, including databases. This information can and should be available via real-time dashboards as well as through ad-hoc reporting. Sadly, I need to write an article on this still. But if you poke around the web you’ll find a fair bit of information. Article to come soon.
Concluding ThoughtsThis was a really interesting workshop. We did it in 75 minutes but it really should have been done in a half day to allow for more detailed discussions about each of the techniques. Having said that, I had several very good conversations with people following the workshop about how valuable and enlightening they found it. This workshop, plus other training and service offerings around agile database and agile data warehousing skills, is something that we can provide to your organization. Feel free to reach out to us. |

.png)


Do you test your ability to respond to emergencies?
|
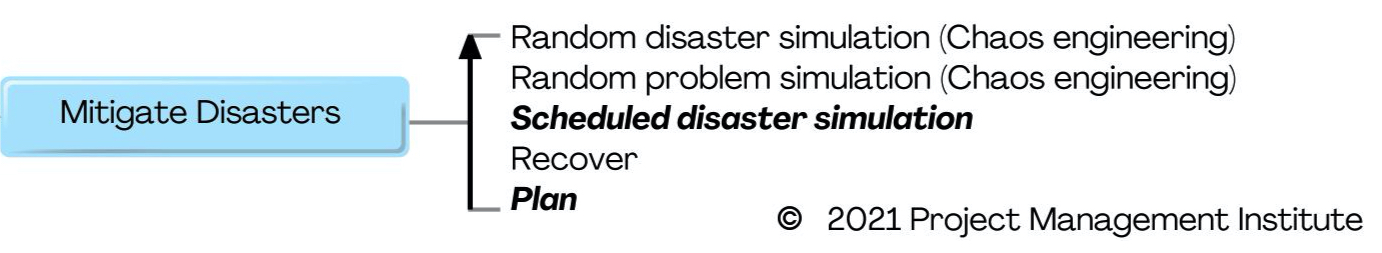
Today in Canada we tested our nationwide emergency response system. Apparently the test failed in the province of Quebec. It did in fact succeed in Ontario, where I live. Knowing about the test I purposefully had my phone on this afternoon because I was interested in what would actually happen. Sure enough, my phone made a very annoying noise and a message came up to inform me that it was just a test. So that was good. An important aspect of IT Operations, and Business Operations for that matter, is to be prepared to respond to emergencies. While the Canadian government is worried about responding to inclement weather, terrorist attacks, military attacks, and coffee being sold out at the local Timmies your IT department should be concerned about ensuring that your systems are running properly, that they are repelling cyber attacks, and that your data centres are operational (to name a few potential issues). This is why the IT Operations process goal includes a process decision point called Mitigate Disasters (see the pic above). By running this scheduled disaster simulation, after careful planning and communication (which I why I had heard about it), the Canadian government has discovered in a controlled test that their strategy needs work. This is exactly the type of thing you want to find out when you have the luxury of safely addressing any problems that you do find. The government certainly wouldn’t have wanted to discover their emergency alert system didn’t work as expect in the middle of an actual emergency. What your organization should ask itself is what would happen if:
Will your IT ecosystem respond properly? Will it recover automatically? Are you guessing at these answers or do you know for sure because you’ve actually simulated them? I hope this blog has been food for thought. Time for a Timmies. |