Measure Outcomes - A New Process Goal


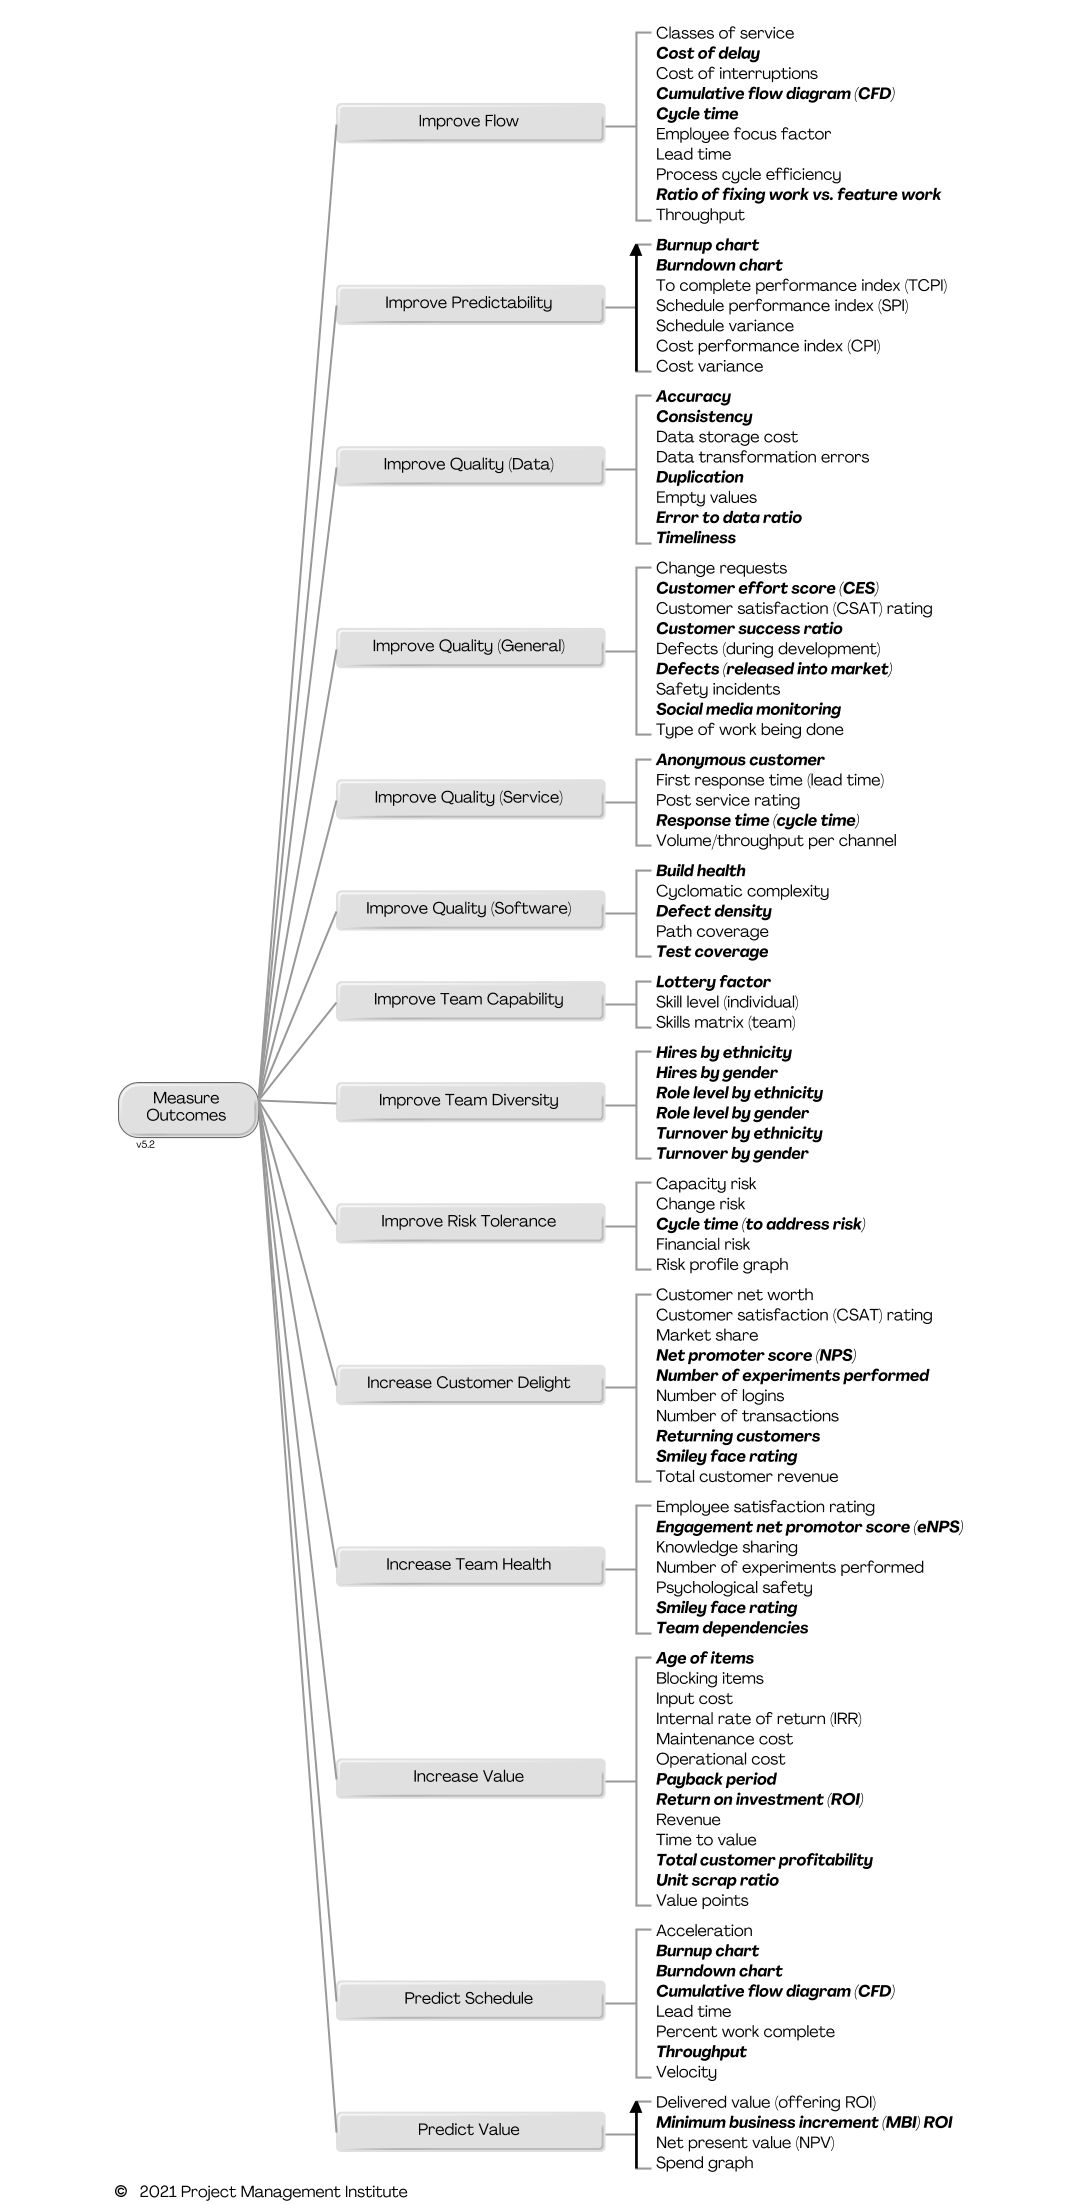
| We recently released the 5.2 version of the Disciplined Agile (DA) tool kit, and in that release we added three new process goals: Intake Work, Organize Metrics, and Measure Outcomes. The focus of this posting is the Measure Outcomes process goal, the goal diagram for which is posted in Figure 1.
Figure 1. The Measure Outcomes process goal diagram (click to enlarge).
The Measure Outcomes process goal describes potential improvement outcomes, or improvement goals, and suggests potential metrics to measure progress against those outcomes. Disciplined Agile doesn't prescribe what to measure, that would be naive because every team is unique with its own priorities and desired outcomes. All of the potential outcomes in Figure 1 are important. However, you will want to focus on a subset at any given time, and that subset is likely to evolve as your improvement focus evolves. Context counts.
Related Resources
|
Organize Metrics - A New Process Goal
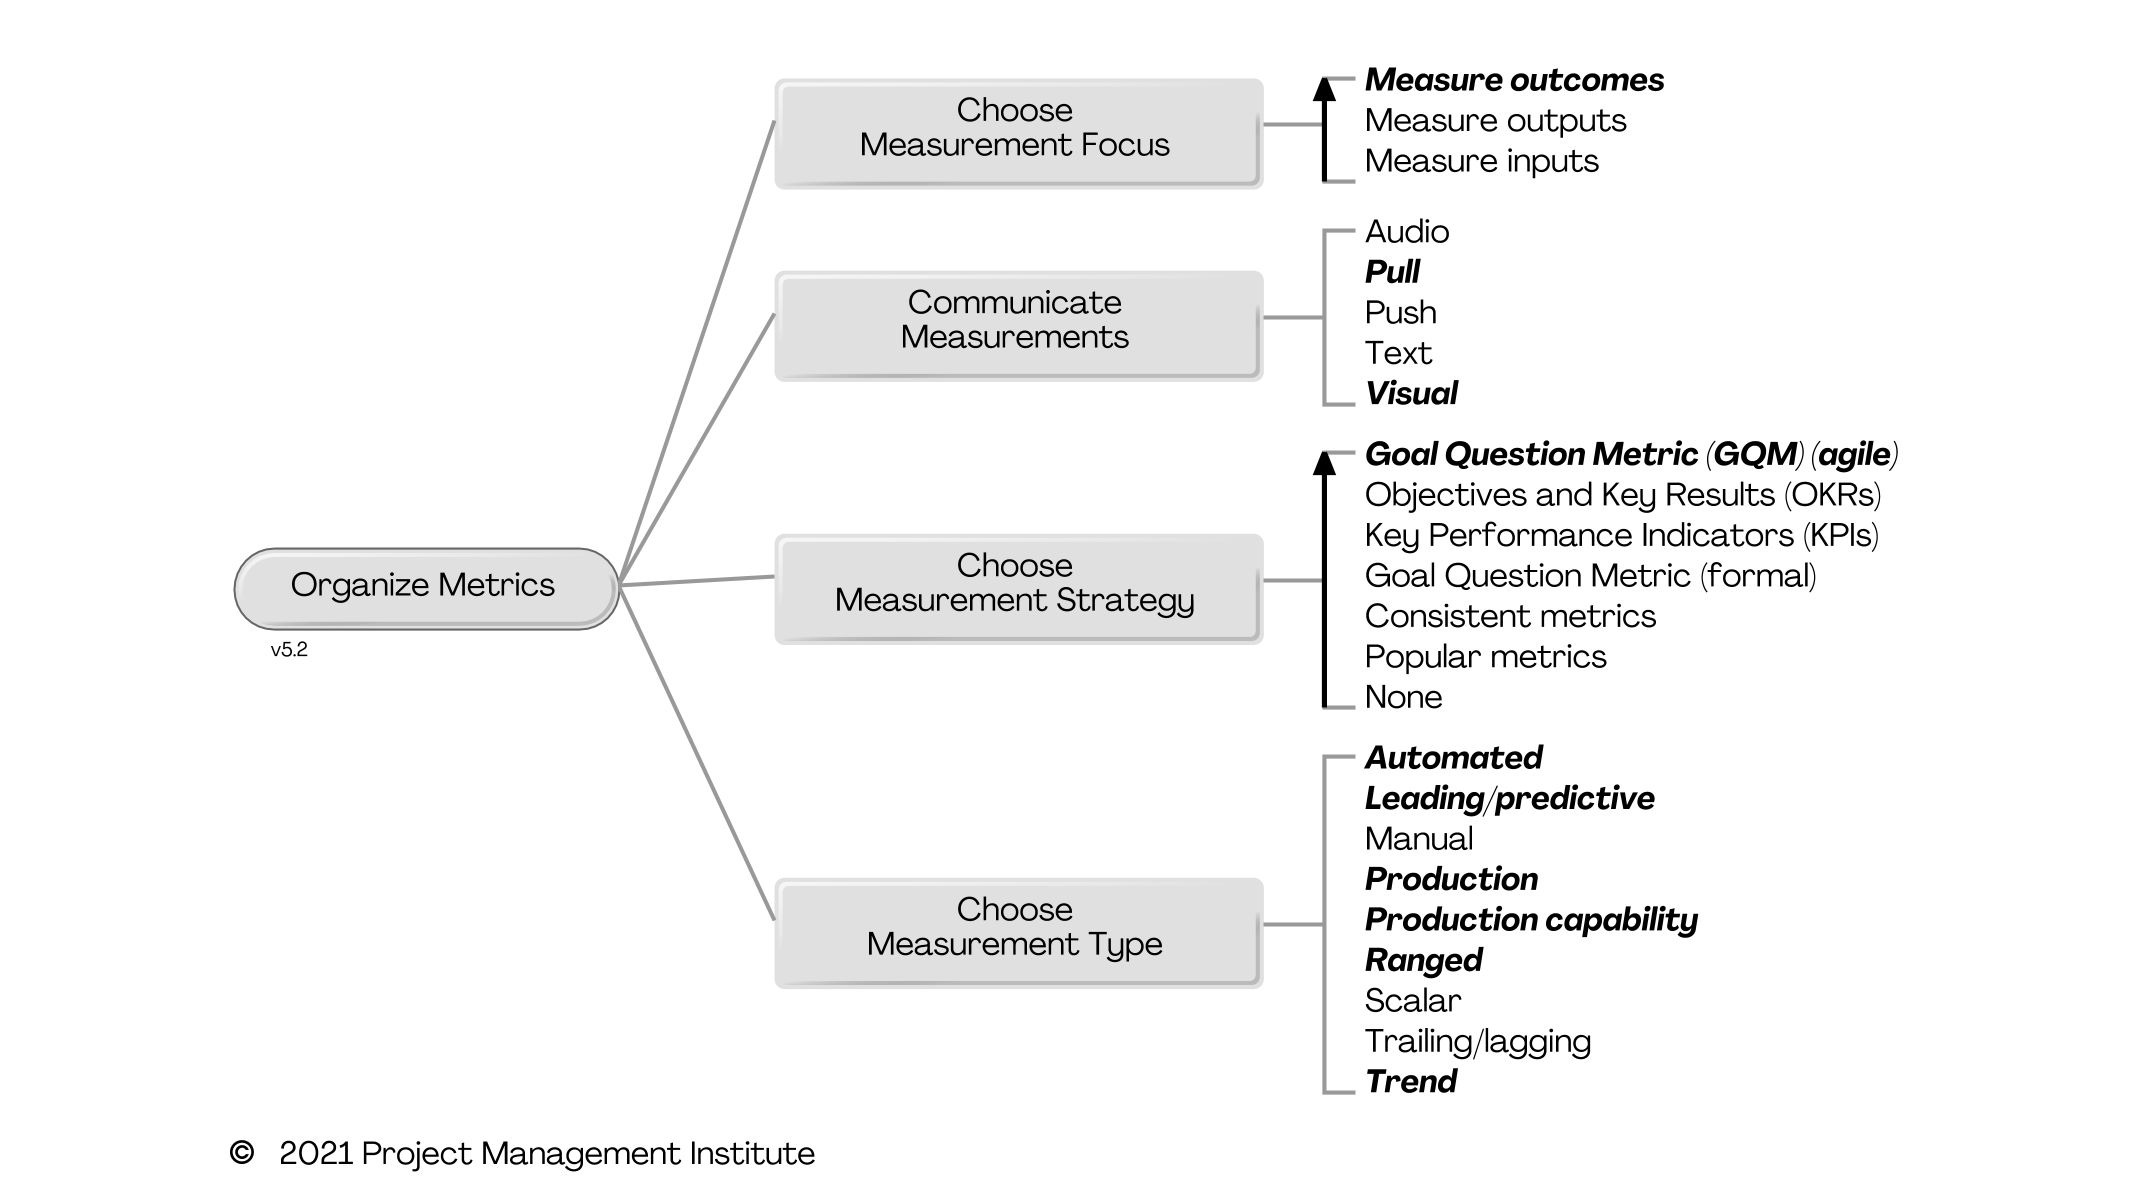
| We recently released the 5.2 version of the Disciplined Agile (DA) tool kit, and in that release we added three new process goals: Intake Work, Organize Metrics, and Measure Outcomes. The focus of this posting is the Organize Metrics process goal, depicted in Figure 1.
Figure 1. The Organize Metrics process goal diagram (click to enlarge).
As the name implies, this process goal describes strategies to organize the metrics approach within your team. This strategy will be driven both by your team's culture and skills as well as the needs of your stakeholders - your metrics will likely need to "roll up" to the program or portfolio level. Your metrics strategy will focus on several important questions:
Where this goal focuses on how to measure, the Measure Outcomes goal describes what to potentially measure.
Related Resources
|
Intake Work - A New Process Goal
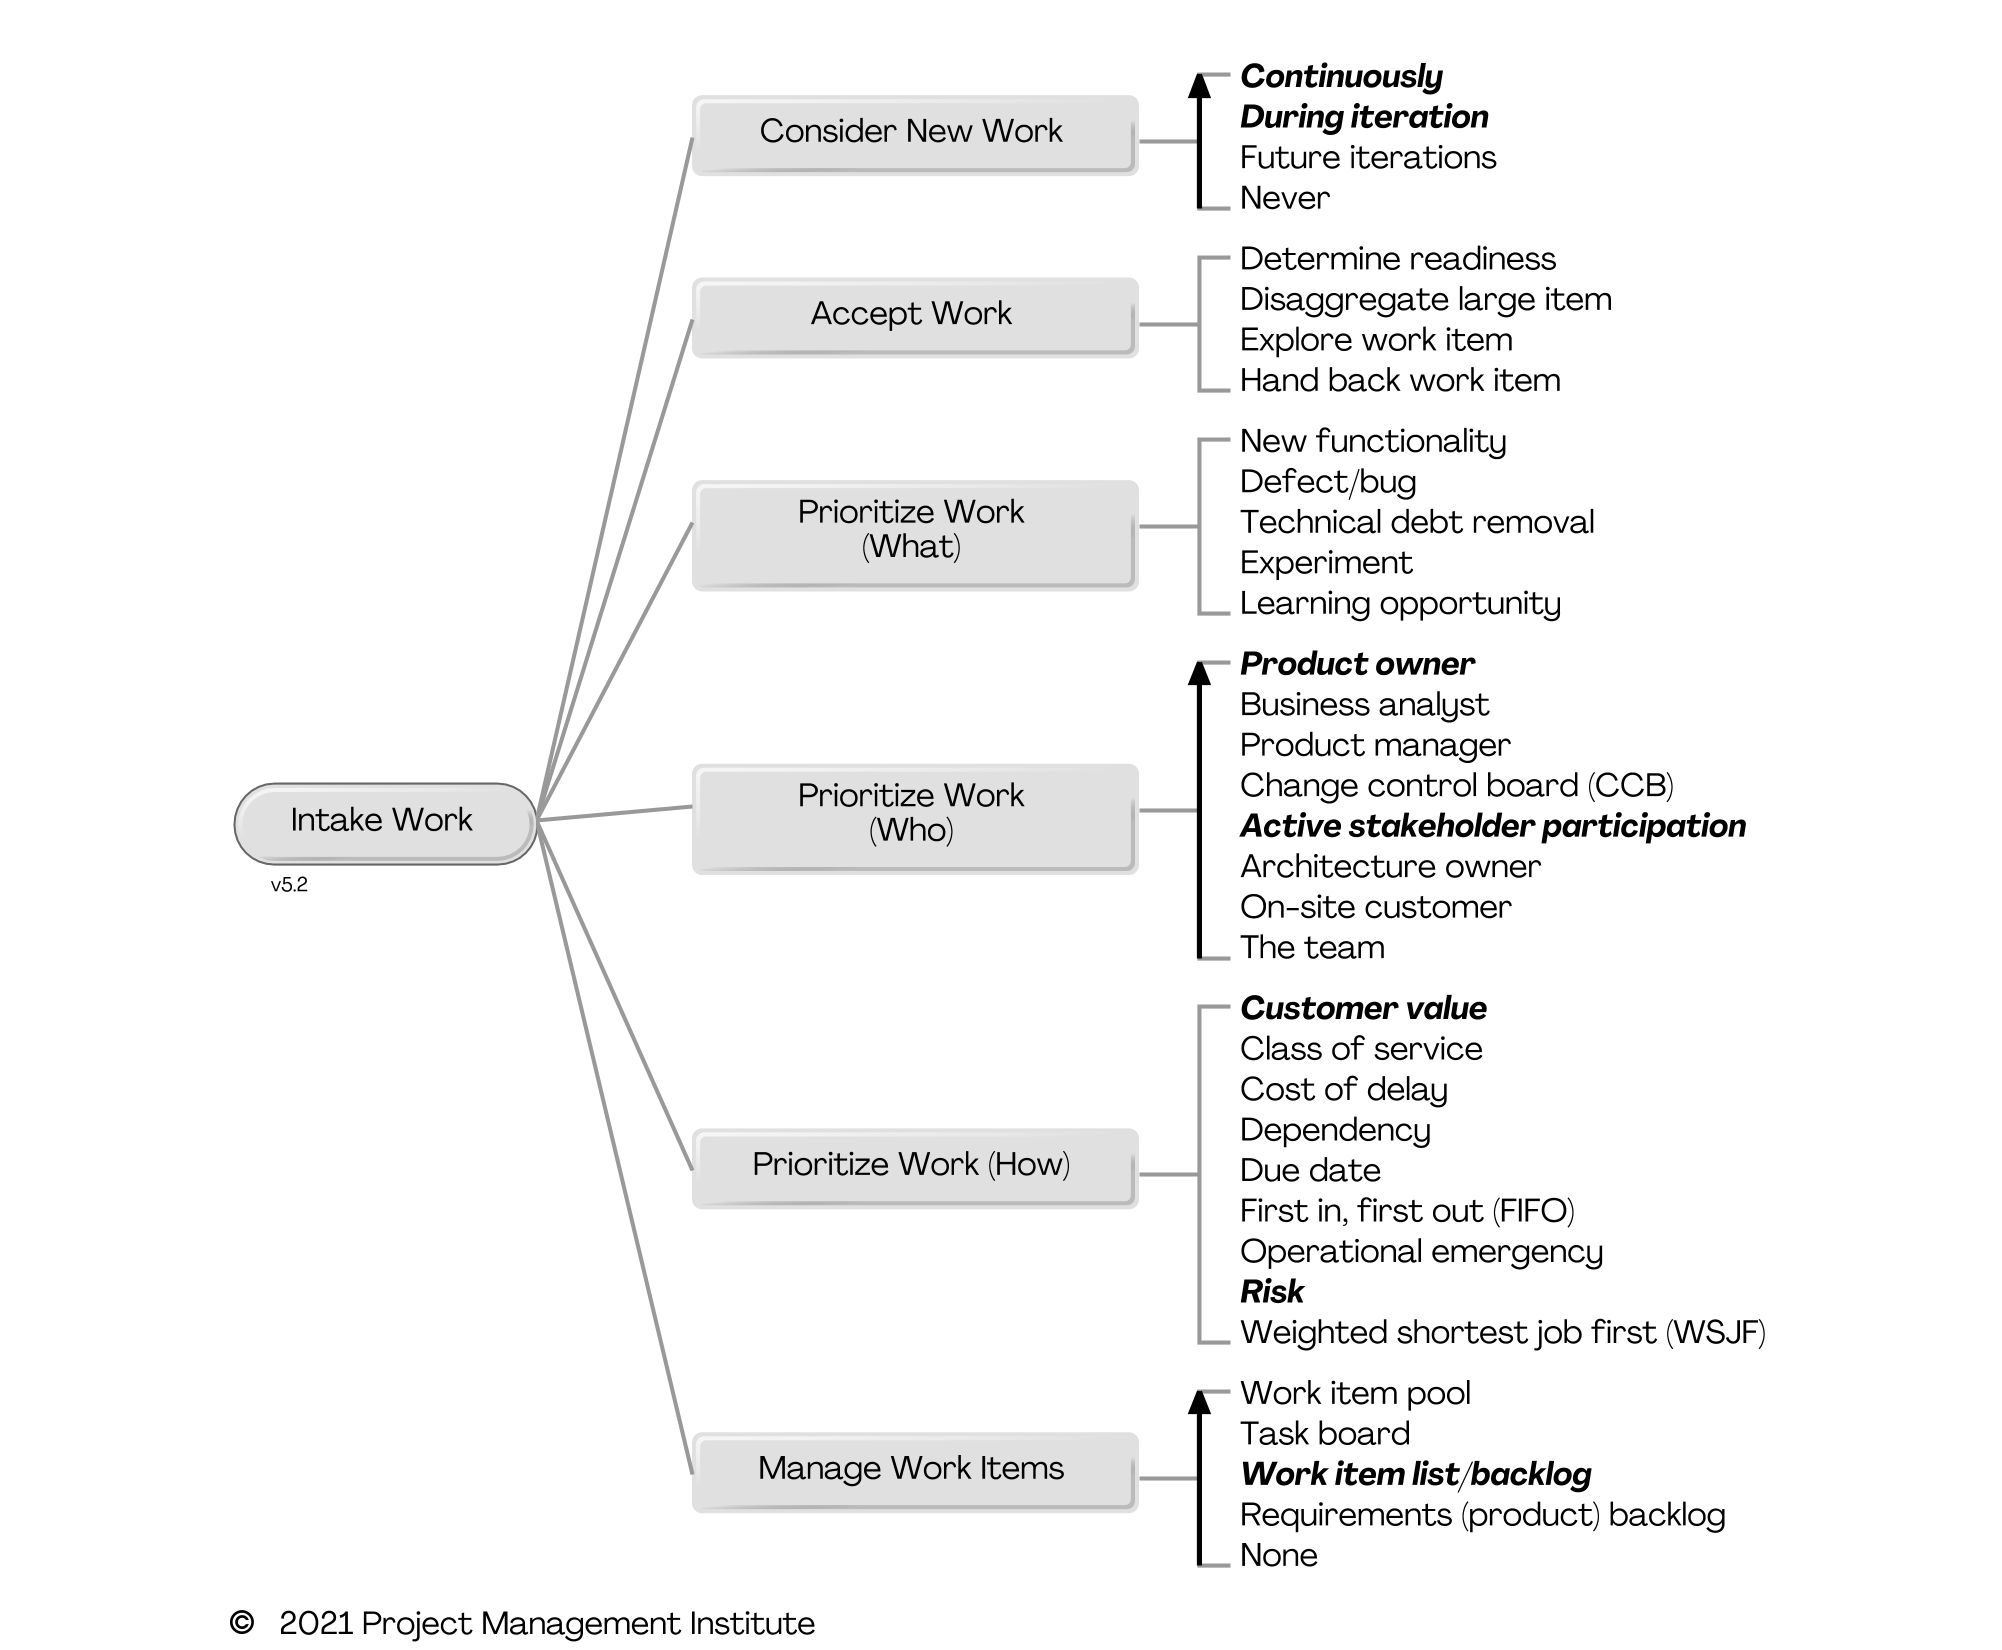
| We recently released the 5.2 version of the Disciplined Agile (DA) tool kit, and in that release we added three new process goals: Intake Work, Organize Metrics, and Measure Outcomes. The focus of this posting is the Intake Work process goal. Intake Work: AddedFigure 1 depicts the process goal diagram for Intake Work (see How to Read Process Goal Diagrams). This is how a team pulls in work from their "upstream" stakeholders. The incoming work is examined and if ready it is prioritized and put on the team's work backlog. We introduced this process goal because we wanted to have a cohesive source of process information capturing the issues around a common activity that is critical to your team's success. Figure 1. The Intake Work process goal diagram (click to enlarge)
To be effective at intaking work, we need to consider several important questions:
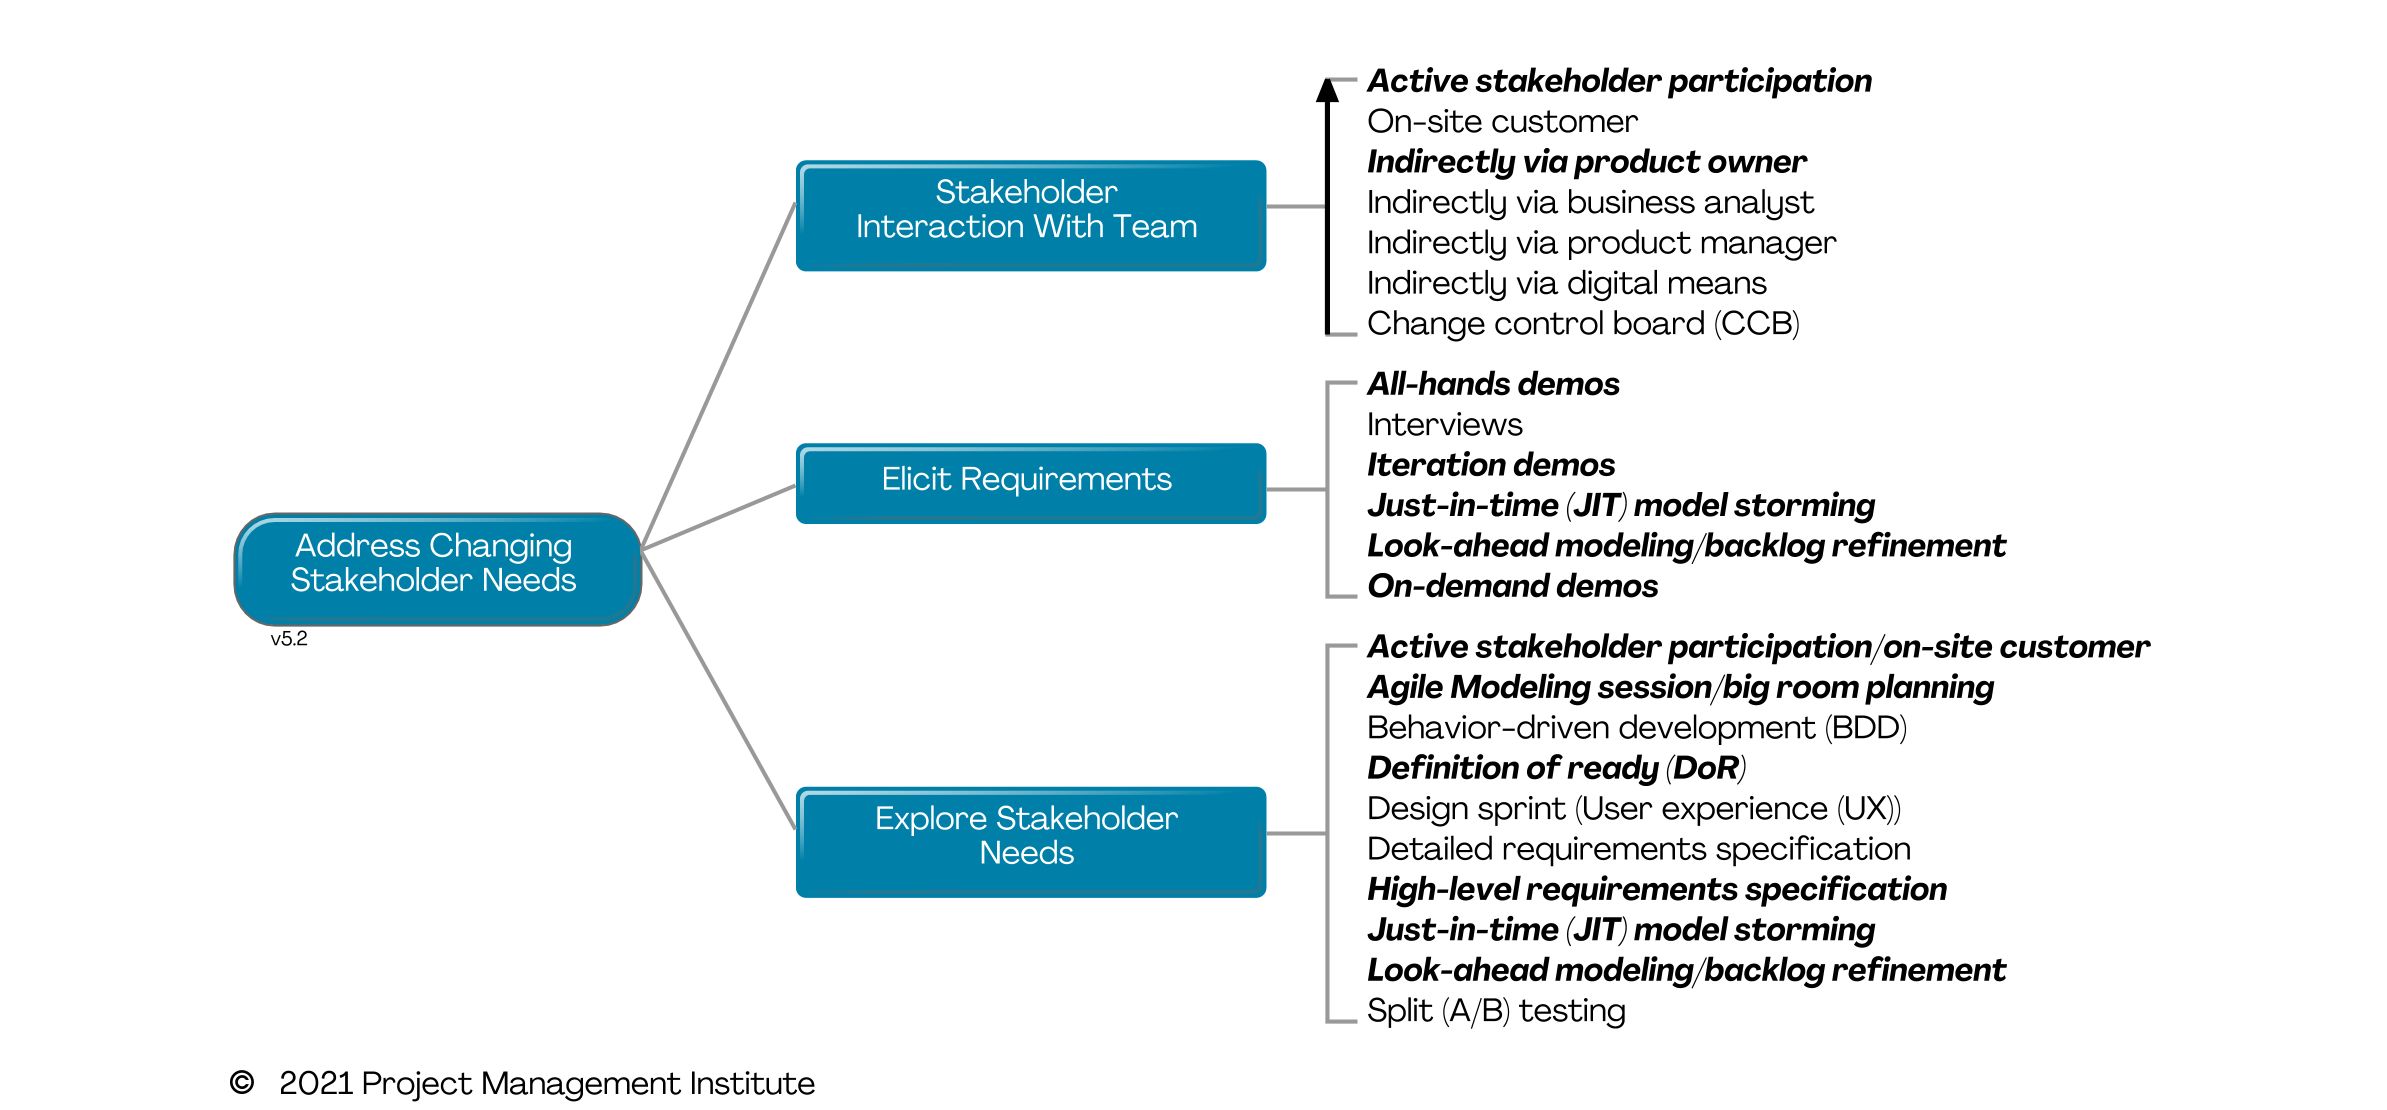
Address Changing Stakeholder Needs: RefactoredPart of the development of Intake Work was the refactoring of Address Changing Stakeholder Needs which previously captured several decision points that focused on intaking work and several on exploring stakeholder needs. Figure 2 depicts the updated goal diagram. Important changes include:
Figure 2. The Address Changing Stakeholder Needs goal diagram (click to enlarge)
Related Resources
|
Accelerate Value Delivery
Categories:
agile,
Goal-Driven,
Construction phase,
testing,
DevOps,
Scrum,
goals,
scaling,
Documentation,
Construction
Categories: agile, Goal-Driven, Construction phase, testing, DevOps, Scrum, goals, scaling, Documentation, Construction
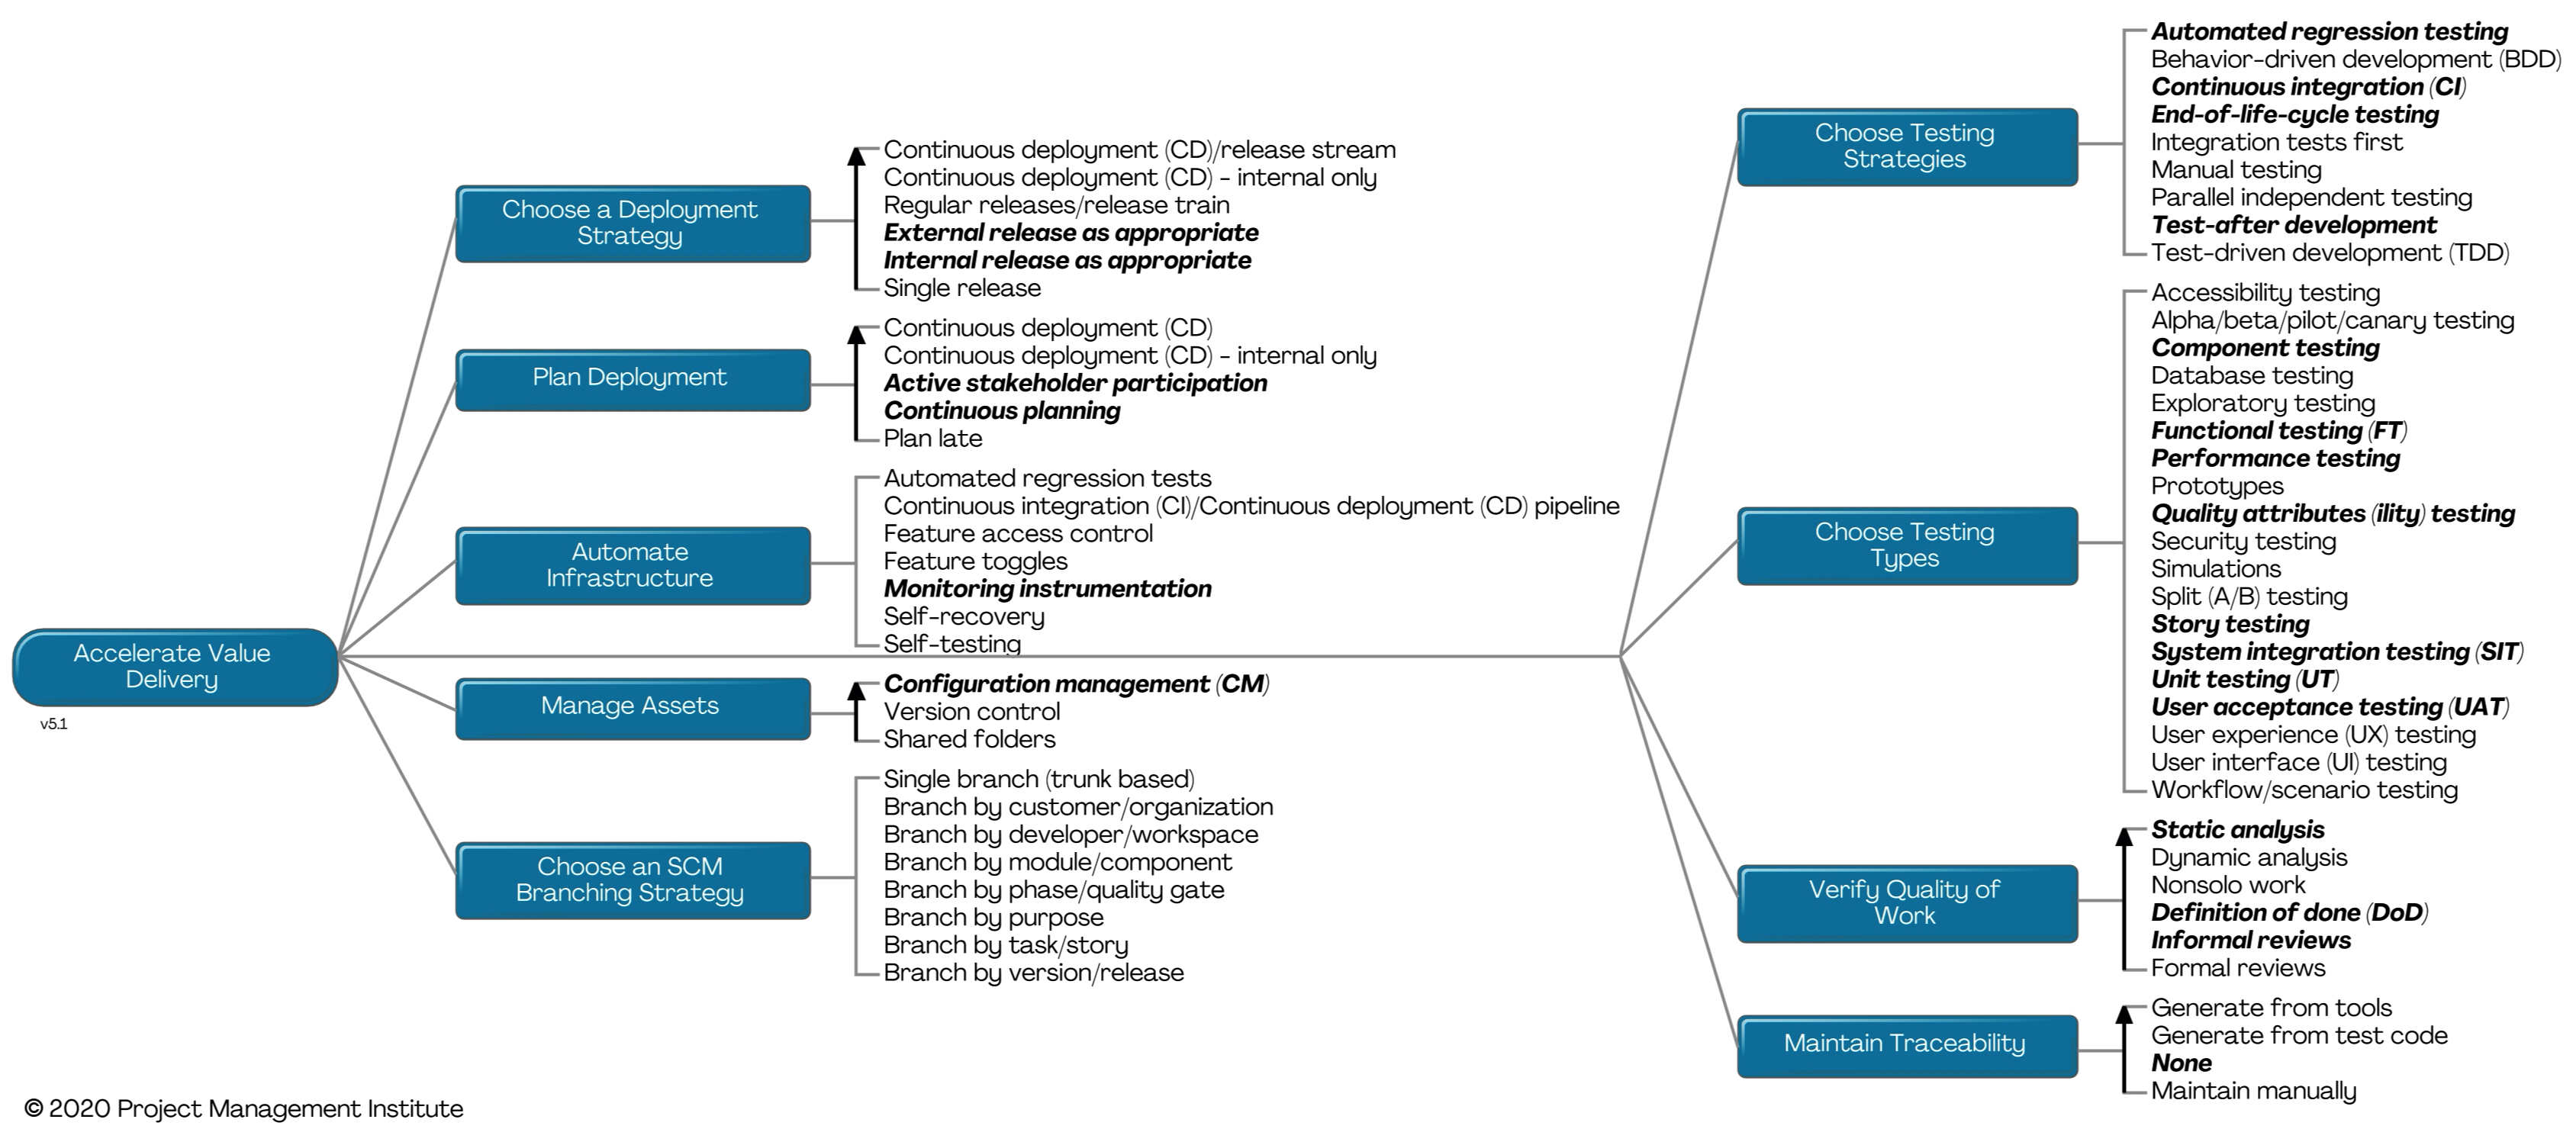
| One of the process goals that a disciplined agile team will want to address during construction is Accelerate Value Delivery. Ideally, in each construction iteration a team will move closer to having a version of their solution that provides sufficient functionality to its stakeholders. This implies that the solution is a minimally viable product (MVP) that adds greater business value than its cost to develop and deploy. Realistically it isn’t a perfect world and sometimes a team will run into a bit of trouble resulting in an iteration where they may not have moved closer to something deployable but hopefully they’ve at least learned from their experiences. This is an important process goal for several reasons. First, it encompasses the packaging aspects of solution development (other important development aspects are addressed by its sister goal Produce a Potentially Consumable Solution). This includes artifact/asset management options such as version control and configuration management as well as your team’s deployment strategy. Second, it provides deployment planning options, from not planning at all (yikes!) to planning late in the lifecycle to the more DevOps-friendly strategies of continuous planning and active stakeholder participation. Third, this goal covers critical validation and verification (V&V) strategies, many of which push testing and quality assurance “left in the lifecycle” so that they’re performed earlier and thereby reducing the average cost of fixing any defects. The process goal diagram for Accelerate Value Delivery is shown below. The rounded rectangle indicates the goal, the squared rectangles indicate issues or process factors that you may need to consider, and the lists in the right hand column represent potential strategies or practices that you may choose to adopt to address those issues. The lists with an arrow to the left are ordered, indicating that in general the options at the top of the list are more preferable from an agile point of view than the options towards the bottom. The highlighted options (bolded and italicized) indicate default starting points for teams looking for a good place to start but who don’t want to invest a lot of time in process tailoring right now. Each of these practices/strategies has advantages and disadvantages, and none are perfect in all situations, which is why it is important to understand the options you have available to you.
Let’s consider each process factor:
We want to share two important observations about this goal. First, this goal, along with Explore Scope, Coordinate Activities, and Identify Architecture Strategy seem to take the brunt of your process tailoring efforts when working at scale. It really does seem to be one of those Pareto situations where 20% addresses 80% of the work, more on this in a future blog posting. As you saw in the discussion of the process issues, the process tailoring decisions that you make regarding this goal will vary greatly based on the various scaling factors. Second, as with all process goal diagrams, the one above doesn’t provide an exhaustive list of options although it does provide a pretty good start. We’re firm believers that a team should tailor their strategy, including their team structure, their work environment, and their process, to reflect the situation that they find themselves in. When it comes to process tailoring, process goal diagrams not only help teams to identify the issues they need to consider they also summarize potential options available to them. Agile teams with a minimal bit of process guidance such as this are in a much better situation to tailor their approach that teams that are trying to figure it out on their own. The DA too lkit provides this guidance. |