Analysing Project Performance in Earned Value Management
Categories:
earned value
Categories: earned value


|
I get it – if you don’t use earned value on your projects, you might be wondering what you can takeaway from The Practice Standard for Earned Value. That was my view too, having never worked on a project where earned value was a necessary part of how we measured performance. However, there are lots of project tracking and performance management tips you can pick up from the standard. As with all things project management, tailoring is the answer. You can choose to apply some of the tools and techniques from the EV canon and ignore the ones that don’t work for you (like last month’s dive into creating the performance measurement baseline, which I can’t imagine doing unless the project/client demanded it). The process we are looking at today is Analyse Project Performance. Unsurprisingly, as you can tell from the name, it’s the process of comparing what we said we would do to what has actually happened, with a view to understanding the current status and taking corrective action where appropriate. You’ll need to do this regardless of whether you use EV on your project or not – admittedly, you won’t have a performance management baseline to use if you aren’t in an EV environment, but part of project management for any type and size of project is doing that comparison and making adjustments accordingly. We do that so we can capitalise on opportunities, mitigate against variances, take action and keep the project on track, as well as predict where we are going to end up if things continue as they are. Top tip: These analyses are best done by EVM software. These days, when tools are so advanced and the state of project management tech is so good, there’s no need to work out variances by hand. Reduce the likelihood of human error and draw on your IT systems to do all this analysis for you. InputsThere are just two inputs to this process: The project management plan – in particular, the performance measurement baseline that was put together in the previous step. There will be other bits of the plan that are useful as well, like variance thresholds if they are documented (they should be) Work performance information – because you use this to compare to the plan and see if you are where you thought you would be. Work performance information in this process is more than simply asking people what they’ve done or taking a look at timesheets. This is where the maths part of EV kicks in: you’re looking at planned value, earned value, actual cost and budget at completion, those staple calculations of an EV management system. I could write whole articles about those formula, so I won’t go into detail about those. For now, know that you’ll need to get project performance data from your software tools and know how to interpret the formula. What to doSo what does it look like to work through this process and analyse project performance? We can break it down a bit. What you’re doing is looking at the variances and performance indices. Look at schedule and cost variance, and work out the schedule performance index, cost performance index and the to complete performance index. When I say ‘work out’, I mean (hopefully) press a button in your software and get a report that does the maths for you, presenting you with an easy-to-read dashboard or data sheet that gives you the information. You can work it all out by hand, and it’s really helpful to know how to work out the formulas and what they are for, but over in the real world, let’s rely on software tools to speed things up. The indices will tell you if you are ahead or behind schedule and budget. That’s good to know, but alone, it’s not really very helpful. We also need to do some forecasting. What that means is we use the EV data to forecast performance forward, giving us information about what things will look like when the project is complete. Again, that’s useful data to help stakeholders understand how the project is going and what actions might be necessary to address any variances. Estimate to complete, estimate at completion, variance at completion and the to complete index are the useful formula here. Finally, you can look at percentage comparisons and trend analysis to help you work out what might happen in the future given past performance. It’s all useful data, but the key thing that jumps out at me is that there is no narrative; no context. You’ll need to add the story to help people understand the ‘why’. OutputsThe outputs from this process are:
Typically, you’ll be looking at graphs and tables, and a lot of numbers. What’s really important is that whoever is looking at the numbers understands what they are looking at, what they represent and what they mean for the project. That might mean doing some team training about EV so that everyone starts from the same common language. There is a ton of detail in The Practice Standard along with a worked example, so if some of these terms don’t mean much to you, or you want to see some ‘real’ graphs that explain what all this is about, I highly recommend checking out the standard for a more in-depth explanation of this process, because most of what we typically think of as EV is this step. This is the time in the process where you compare planned performance (the performance measurement baseline) to current performance. Some variance is to be expected because life happens and changes are part of managing the work. However, the management skill is in balancing the work to address any variances and bring the project back within metrics to show it is in control. Next time, I’ll be diving into the next process in the earned value management standard, which is maintaining the performance measurement baseline. Pin for later reading
|


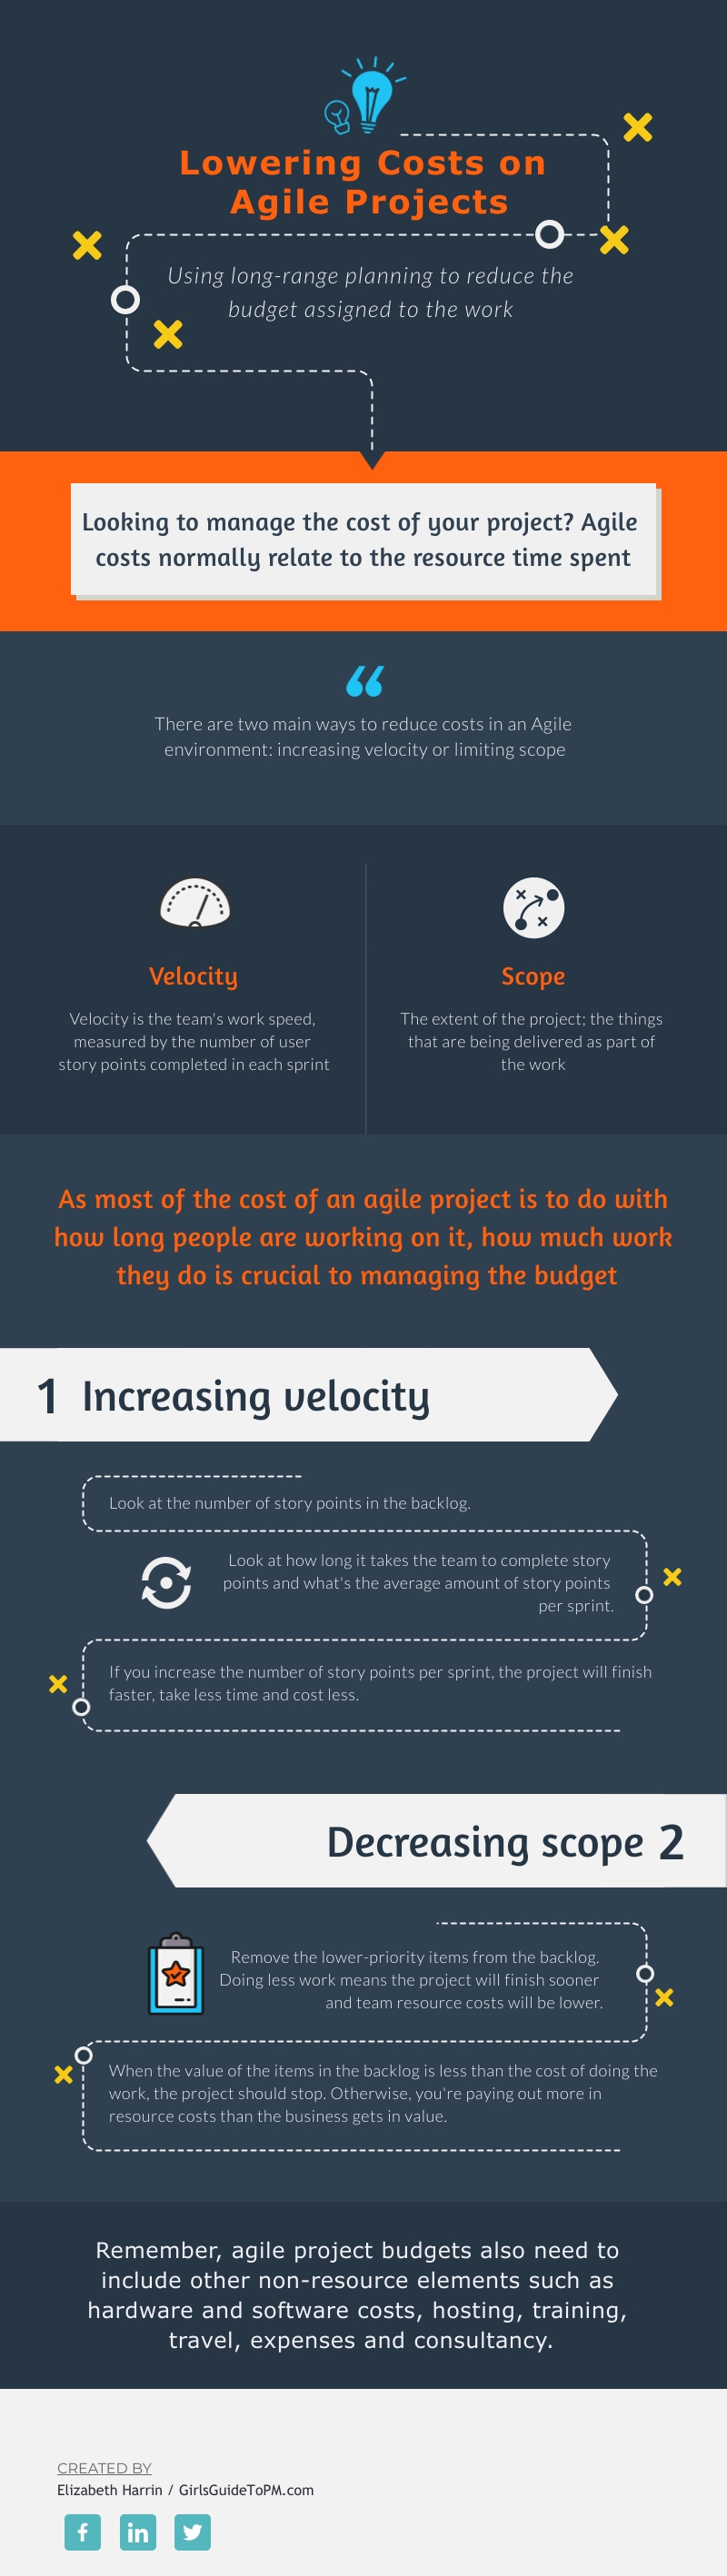
2 Ways to Lower the Cost of an Agile Project [Infographic]
| Given the type of work that normally happens in an agile project – yes, we’re talking IT development – it’s common that the largest overhead is normally the team. People cost money because we have to pay their salaries. All the while they are tied up on a project they aren’t doing other projects. Those other projects could be more valuable to the organization. So it does matter how people spend their time. If you are asked to cut the time of an agile deployment, how can you do it? If we’re focusing on staff costs, there are two main ways: increasing velocity (i.e. working more efficiently and doing more in less time) or decreasing scope (i.e. doing less so you finish earlier). The infographic below shares a bit more about these two options. What are your top tips for cutting costs in an agile project without cutting quality? Are there other techniques you use? Share them in the comments below!
|
3 Impacts of Risk Management [Video]
Categories:
risk
Categories: risk
|
Poor risk management can impact your project and massively affect your business more broadly as well. In this video, I discuss 3 impacts of less-than-optimal risk management which you might not have considered:
Interested in finding out why risk management can affect those areas of your project and what you can do about them? There’s more in the video! You can switch subtitles on if you are in a place where you can’t have the sound up or have other reasons to want to use closed captioning: Simply click the little icon at the bottom of the video that looks like a square with dots in, and the subtitles will automagically appear for you.
Pin for later reading
|


Establishing the Performance Measurement Baseline in Earned Value Management
Categories:
earned value
Categories: earned value
|
If you’ve been following along with my monthly dive into The Practice Standard for Earned Value, you’ll know that I’ve been picking up a lot of tips along the way. I’ll be honest – I don’t work on projects that use EV. However, that’s not to say that I can’t learn from the standard, and pick out things that apply to my non-EV projects. For example, last month I looked at the process around performance measurement methods, and it was good to refresh myself on different ways of tracking progress like discrete effort, apportioned effort and level of effort. Those are tools I can use to think about progress tracking on any project, because you should know how you are going to measure success before you start, regardless of whether EV is part of your toolkit or not. The Establish Performance Measurement Baseline is where we take all the scope, schedule and cost baseline info and blend it all together to create an integrated baseline from which to track performance. It’s the guide against which we’ll measure ourselves and our project to ensure we are on track. I said last time that performance measurement methods was the most important part of the whole EV journey – now I’m not so sure. This integrated baseline is the starting point for project control, and what can we do if we don’t have that? Perhaps I need to rethink my priorities and put this baseline at the top of the tree for EV components. (In reality, it’s all important, I guess.) InputsThere are four inputs to this process:
The first three are pretty obvious, but what is the risk register doing in there? Aha – it’s all part of a holistic, robust way of looking at the work. The project plan includes the tasks, but the risk register includes another set of tasks: your risk management activities that help you implement the risk responses (and the budget required for those). EV is a truly rounded way of looking at project scheduling, so it’s important to acknowledge that if the team are off doing risk mitigation work (or trying to optimise for opportunity risk), they aren’t delivering tasks from the ‘main’ project schedule. And you need to account for that time and effort. And budget. So it’s important that your risk activity is taken into consideration for the baseline. What to doThere is a lot of work to do to integrate everything. Let’s hope that in real life software can do a lot of the heavy lifting for you. However, the standard sets out the steps that need to happen, regardless of whether your IT tools can make short work of doing them. First, the team integrates all the different elements together. Take the scope, the schedule, the cost baselines and blend them all together with the risk response plans. You might not have all the detail for the full duration of the project, so do what you can with what you have – the rest can be progressively elaborated later as you get closer to the deliverables and know more about what is expected. Next, check you’ve got your project budget base and management reserve figures. Finally, create the performance measurement baseline. Blend the schedule and budget information together. It’s a time-phased view of what needs to be done and how much it costs. OutputsThe outputs from this process are:
There’s a lot that goes into this step, and a lot more covered by the standard than I can fit in here, with regards to this process. Take the time to get this right because it shapes everything else to come and how reliable your reporting is going to be. Remember, that’s why we are doing all of this, because the reports from EV are helpful and let us course correct as soon as possible to give us more chance of completing the project on time, on budget and to the desired scope. Next time, I’ll be looking at the next process in the earned value management standard, which is analysing project performance. Now we’ve created that baseline, the next step is to get the project going and track our work against it. Pin for later reading
|

How to Create a Project Budget Step-by-Step [Infographic]
Categories:
budget
Categories: budget
|
Project budgeting seems to be a topic that worries project managers more than any other. Perhaps it’s because people don’t feel comfortable doing it, as many project managers actually don’t have responsibility for the finances. It very much depends on your organisation and their processes, and the kinds of projects you are managing. For example, I frequently mentor people and hear them say that they don’t have responsibility for project finances. And when I teach project management, the Project Financial Management lesson is the one we always get through the fastest as people don’t seem to have much practical use for it. This is wrong. Project managers should have responsibility for the finances. How can you monitor and control the work and make the right decisions if you don’t see the numbers? Having said that, I know that I’ve worked on projects where the cost has been internal resource only, and we haven’t had a budget, let alone the need to track external spend. If you are in that situation, I would suggest that you volunteer to track hours spent (for ‘resource-only projects) or that you offer to take on the tracking of the budget even if you can’t wrestle away control of the actual purse from someone else. Then at least you’ll be starting to gain experience and show that people in your organization can be responsible for handing the money. Here’s how I would go about creating a project budget. First, make sure you have a grasp of how much the sponsor is prepared to pay. Have you already heard them say it’s important to keep costs down or do things cheaply to save cost? Then you know you’ll need to manage the budget and estimate accordingly. Then work through the steps in the infographic below. You guys always have such helpful feedback on my images. What do you think I’ve forgotten from this one? What else do you do when setting up a project budget for the first time? Let me know in the comments!
|