What to look for in project management software: Data privacy edition


| Over the past few articles I’ve talked about different aspects of data privacy and how that links to project management deliverables and the ways of working for the team. One of the big things that we use as project managers is our software, and often we’re involved with selecting new tools or upgrading existing tools. In this article, I wanted to point out a few things you should be looking for in your PM tools to make sure that you’re having the right conversations about whether they are secure enough for your data. I’m sure your info sec teams will also have a lot to say, so use the content below as a starting point for a discussion, not a replacement for guidance from your internal teams!
Access control and permissionsEnsure that the tool allows for granular control over who can access sensitive data. Role-based access control (RBAC) is essential for minimising the risk of unauthorised access. What this looks like in practice is that you might have one person on the team with admin or ‘override’ permissions, and everyone else just enters the data. In one company I know, the workflow pushes a project between stages. While it’s going through the approval process, no one can edit the data. That’s good because it means all approvers are seeing the same thing, but also a bit annoying if you’ve accidentally left something out or there is another very valid reason for needing to add another attachment, for example. Admin users could have the power to make changes while a record is blocked for editing by ‘normal’ users, but it’s a power to use very carefully! Data encryptionVerify whether the tool provides end-to-end encryption for both data at rest and data in transit. This ensures that data remains secure even if intercepted, which is important for software that is hosted in the cloud, or for financial information. I don’t know why you’d need information like bank card records in a project management tool, but even your business case information should be company-confidential and you wouldn’t want it accessible in case of a data breach. Data storage and backupAssess where the data is stored and whether that meets your requirements. For example, in the UK there are rules around where patient data is stored in the healthcare industry – we couldn’t have certain data stored in off-shore data centres, for example. Check out your regional data privacy laws. Again, project management software isn’t going to have the kind of sensitive, personal information that’s on the same scale as medical records, but you still want to be sure it meets your company’s policies for storage. The same goes for backup. However good your internal systems and however reliable your supplier, can you get the data back when there’s a problem? Audit logsThis feature is so helpful in the project management software that I use. It’s great to easily be able to see what changed, when and who changed it. Check if the tool has built-in auditing and tracking features that allow for monitoring access to data and changes to project information. And if it does, who has access to see the audit logs (I’m a believer in transparency here – why not make them available to everyone?). CertificationsIf you’re using software that you’ve bought in, check to see if it (or the company that makes it) has any data or compliance-related credentials like ISO 27001, SOC 2, or EU-U.S. Privacy Shield, which indicate that the tool has passed rigorous security and privacy assessments. That’s not an exclusive list, but you can use the ideas above as a starting point for thinking about the requirements for data security and privacy for your project management software. What did I leave out? Let me know in the comments! |

Benefits of visual reporting
| We do a lot of our reporting in PowerPoint, which is a tool I like using. However, it does often involve recreating data from other sources on a slide so it can be included in a deck. Over the years, I’ve noticed a shift towards more visual forms of reporting, like dashboards and slides. Slides lend themselves to graphical story telling far better than documents, and are good for the busy exec who wants to flick through the headlines without getting lost in the many pages of a PID or project plan. We all use a lot of words for our reporting, but if you’re trying to get your message across, making your reports more visual can make a difference. Here are some advantages to consider. Charts and graphs make your documents shorterCharts, graphs and tables make your documents shorter because you can say more in a small space. Visuals make your documents more concise and impactful, perfect for the busy senior manager who just wants to skim. Let’s face it, we all have information overload and busy brains, so the less work they have to do to understand the point, the better. Shorter documents reduce cognitive load and aid retention, so they might even remember the point next month!
Colours highlight statusYou’re probably familiar with Red/Amber/Green colour coding for projects. The judicious use of colour makes it easy to see status at a glance. That means execs can focus in on the projects that need management attention. Watch out for how you use colour though, to make sure your reports are accessible to all stakeholders: readers with colour deficiency or people who prefer to print content in black and white won’t automatically understand your statuses unless you use the words too. Data presents the factsWorried about how your sponsor might spin project status? If you present the facts in graphical format, that will support the narrative. Even if your sponsor says everything is wonderful, sharing (for example) the number of red/high risks or open issues is a way to draw attention to the fact not everything is going as well as it could. Data, in graphical format, leads to objective reporting. Having said that, I’m sure you’ve heard people say that you can spin data in any way. So make sure your sources are clear and that you report like-for-like measures month-on-month for comparison. Links to drill down into the data will show that you value transparency. If you want to get better at visual reporting, think about where the data is coming from and how you can present it. I got some amazing tips from the book Good Charts by Scott Berinato. It is an eye-opening look at how to position your data for maximum understandability and storytelling. As well as the analytical thinking that you’ll want to do before you present any data, it’s also worth brushing up your technical skills, whether that’s a quick PowerPoint course or making sure you know how to use all the dashboarding and customisation features of your project management software, so you can get the data out in a format that makes it easy to share and talk about. Lots of common project metrics lend themselves well to being presented visually: timelines, budget allocations, pie charts of risk ratings and so on. Why not experiment with what you can make more visual in your next project update? |

Pitfalls to avoid for lessons learned
Categories:
project data,
success factors,
reports,
stakeholders,
Lessons Learned,
Teams,
Organizational Culture
Categories: project data, success factors, reports, stakeholders, Lessons Learned, Teams, Organizational Culture
| Last time I looked at some tips for making lessons learned sessions run a bit more smoothly, and it made me think about some of the pitfalls we see when facilitating those sessions. My own experience is with using the model associated with predictive projects, but I imagine you could get stuck with these pitfalls if you were doing retrospectives with an agile team as well.
Here are some things to look out for once your lessons learned conversation is in the diary. Focusing on only the negative things. Don’t let the session focus only on the negative. Yes, people like to have the opportunity to share the things that didn’t go well. If it helps the atmosphere to have a moan about the elephant in the room, then do so. But make sure there’s some time on the agenda left to discuss the working practices that were successful, otherwise you’ll all leave the meeting feeling like nothing went well, and I’m sure that wasn’t the case. Making the sessions too long or too short. Who wants to give up an afternoon for a workshop? No one. And yet if your session is too short, you won’t have time to properly address any issues, come up with action plans or go through the agenda. The exact length of time is going to depend on what you’re wanting to cover and how much prep the team have done beforehand. Question why you need longer than an hour. The same topics coming up regularly because they haven’t been handled. Regular lessons learned are part of the process, but too frequent and you won’t have had a chance to fix anything – and the same problems will come up again. Listening to people say they suffered the same challenges because nothing has changed is annoying and frustrating and leaves people wondering what the point is of raising anything if nothing will be done. People not feeling safe to speak up. Psychological safety is important if you want to get to the truth, but if no one is prepared to share what they thought didn’t go well, you won’t be able to improve. This is a hard one to address if the organisational culture is conspiring against you, but have a think about how you may be able to overcome it if it’s a risk for you. Having smaller sessions with targeted conversations, or anonymous surveys might be options. Not doing anything with the output. Yep, this is all about leaving your lessons documented in a folder gathering electronic dust somewhere. Not good. Make sure they are turned into actions and have people responsible for doing something with them. At the very least, share them with the other project managers in your group. Not being able to determine actions properly as you don’t have the detail to hand. So you’ve recognised you need to do something to change a process? If you don’t have the As Is process to hand, it might be hard to work out the action required to make the improvement. And that basically means the improvement won’t get done as what are the chances of someone doing the mapping and analysis afterwards? Unless the leadership team puts a lot of emphasis on follow up, you might miss that out. These are some of the pitfalls of holding reflection sessions, but by all means I’m sure this list is not definitive. What are the other challenges you’ve found in your own meetings? Let me know in the comments! |

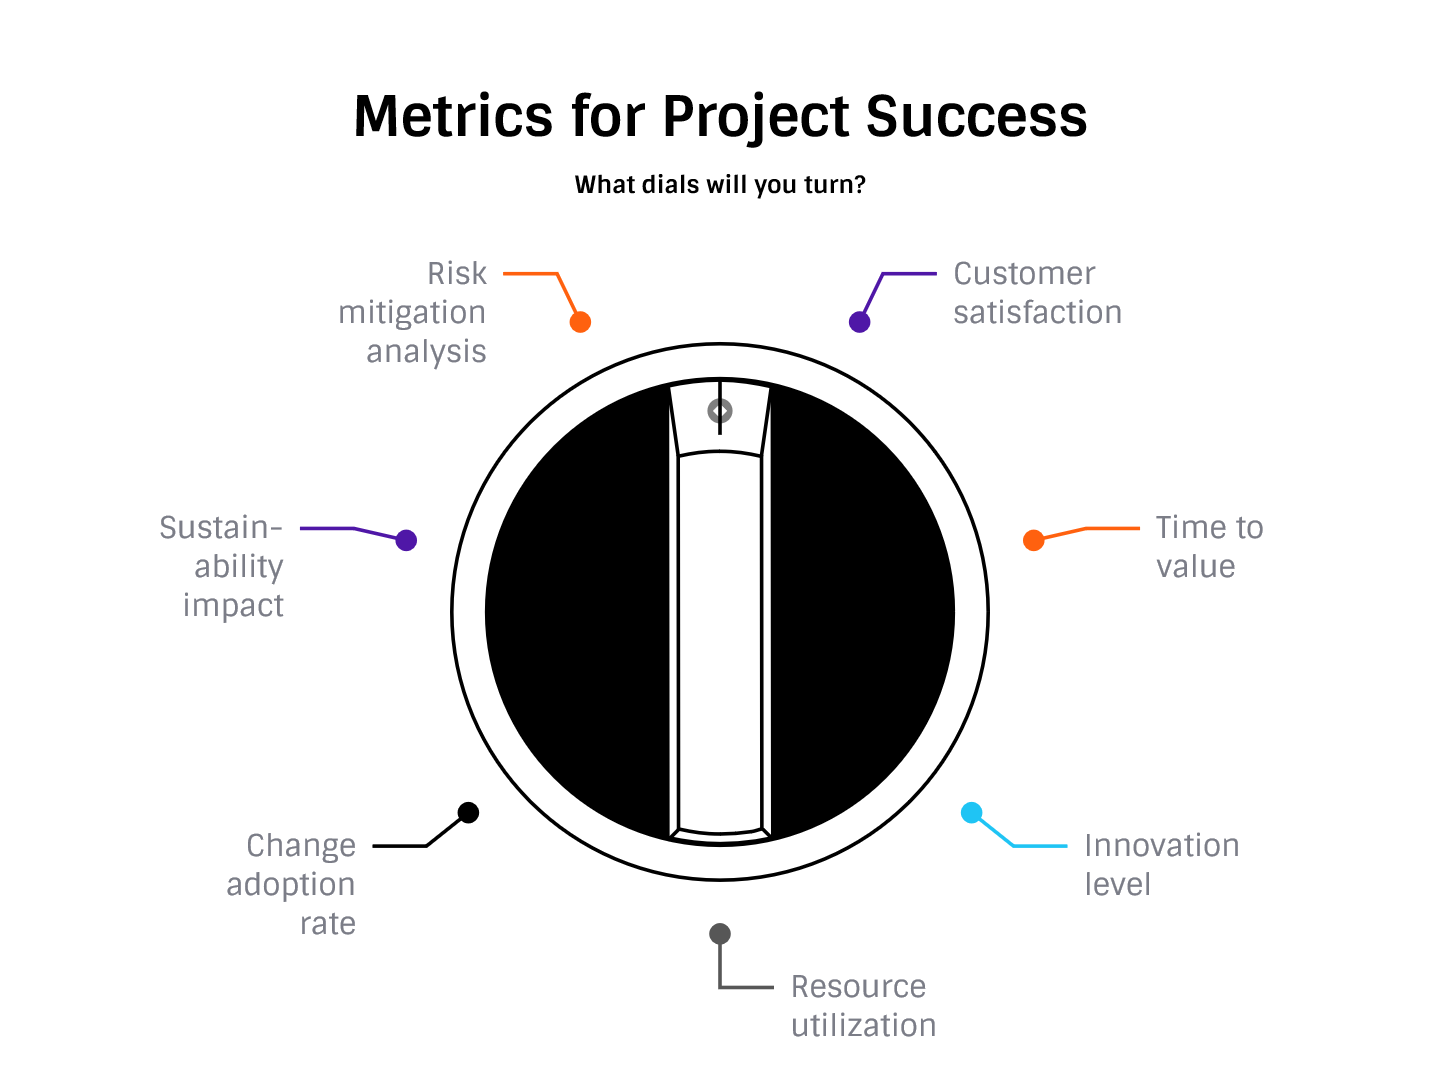
7 Alternative Metrics for Assessing Success
| We’ve all got metrics we use to assess project success: cycle time, earned value and so on. As the year ends, maybe it’s time to look at some other measures we could use that might be a bit more… dare I say… interesting? Below, I’ve suggested 7 alternative metrics you could put in place (some easily, some would take more thought and set up) to look at what project performance really means in the round.
You might find CSAT in use across other teams. Why not implement it for project management customers too? Even if you work in-house, you will have internal customers. Trust me, they have an opinion on the project management service you provide. Why not check in with them directly and ask for it? You don’t need a formal CSAT tool. Set some survey questions and set up a form to ask stakeholders their views, and then collate the results.
Cycle time is worth knowing, but does the end of your cycle always end in value delivered? A different way of thinking about it would be time to value: how quickly the project delivers tangible value per feature, or perhaps overall. This metric comes with the added challenge of having to define value: but that could be a very useful exercise for stakeholders!
Could you create your own innovation index? There are already indices in use like the Global Innovation Index, but that’s probably overkill for our projects. Consider how innovative the product/deliverables are and the method used to implement them.
Here’s one you can probably get from your project management software but I don’t see it on reports very often. What could you take from a utilization report? Metrics are only helpful if there is something you can use them for, like decision support. In this case, it would be making sure the team is adequately resourced, so you really want to be looking forward not backward. Although historical data is useful too to see if there is a trend towards over or under staffing.
Could you create a metric that looks at how quickly the organization is adopting new changes? If you work with a change manager, they might have some ideas about how to implement this. Any new process changes or anything that requires training could be included, even if your measure was only based on smiley faces!
Your procurement team might already have a sustainability index based on their work with vendors and a sustainable supply chain. If you have an energy team, they might have measures you can pull into your projects too. For example, how much carbon saving your project is creating, or how much waste is recycled from different locations.
We mitigate risks, but are those actions really useful? We could draw on AI-powered insights by plugging in risk mitigation activities across a selection of risks and the outcomes. (Or you could work through this manually). I’m not sure how you’d assess the usefulness of the mitigation strategy: maybe on a scale of 1-5? Then you could see which actions had the biggest impact in reducing the risk. There are lots of ways to measure project performance, and no one wants to be creating reports and tracking metrics for the sake of it. However, it might be worth looking at whether your current suite of metrics truly give you the complete, holistic picture of performance, because we all know it goes beyond time, cost and quality. |
4 Ways to Measure Discrete Effort (Part 1)
|
Discrete effort is the name given to the work required for an activity that can be planned, measured and ends up with something specific as the output. The effort involved directly links to the delivery of the thing you are creating. There are four ways of measuring progress on a task that is managed with discrete effort. Even if this description of what discrete effort is doesn’t make much sense to you, you’ll start to realise what tasks are appropriate to be planned in this way when you see how you track them. The four methods of measurement are:
Now you see how to measure the work on these tasks, can you think of some activities that use discrete effort on your schedule? I have to confess to spending many years using percent complete before I ditched it: it’s not really suitable for business change projects where the output doesn’t easily break down on a percentage basis. On one project we used weighted milestones, as that aligned with the contract agreement for billing. All the methods have their place. In this article I’m going to look at the first two: percent complete and fixed formula, and then in the future post I’ll dig into the others. Percent completePercent complete is exactly as the name suggests: the measure is an estimate of how much has been done in percentage terms, tracked at the end of each reporting period. Ideally, it should be based on some kind of measurable thing instead of just a number that the team member has come up with. Have you ever been in a meeting where a task is reported at 90% complete for several weeks? I have. In the end, Chris and his 90% complete became a running joke. There was always something his team was working on that was 90% complete – but not quite ready to be signed off. With percent complete, the planned value (PV) represents the time-phased resource needed to finish the work package. Earned value is then calculated by multiplying the percent complete by the budget at completion for the work package. In other words, you simply use the relevant percent complete for the budget. If the budget for a work package is £100, and the task is 60% complete, the EV is £63. That makes it easy to work out. The challenge with using percent complete is that it is not easy to work out. You need to do so in an objective way, and that kind of goes against the grain for many stakeholders, especially team members who haven’t worked in a disciplined EV way before. They might be used to providing very subjective guesses for percent complete, and that’s really not what you are going for here. Often people use hours worked as a guide for percent complete, but again that’s not always 100% accurate. You could have worked half the time but the deliverable only be 20% complete. The remaining 80% will be achieved with the remaining work hours. So you do have to be a bit careful about how percent complete is implemented – this is why we document how performance will be measured so there is no ambiguity. Fixed formulaThe fixed formula method of progress tracking relies on there being a formula you can use (the clue is in the name). You assign a specific percentage of the budget value of the work package when the work begins. Then the rest of the budget (or time) is assigned when the work is completed. For example: A task starts. You assign it as 25% complete, in terms of budget and/or schedule. Then when the work is finished, the work package “earns” the remaining 75%. You can do this as a 50/50 split or any other breakdown that works for you. Obviously, the total assigned to each milestone in the work package must equal 100%. You don’t have to limit yourself to an allocation at the beginning and then another at the end: if it makes sense to split the task into 5 and assign 20% of the value at each of those fixed points, then do that instead. This is a good method for allocating value in environments using earned value management, or where you have to report progress at work package level but don’t have the data to track things hour by hour to give you an exact percent complete score. It’s also a very easy method to use. Once you have your formula set up and your assignments clear, you can just get on with doing the work. The performance measurement will be pretty seamless, as long as you are confident work is progressing to plan. And there’s no cajooling the team into coming up with measures that are a few percentage point higher than last week just to prove something has been done in the last 5 days. Good for: short duration tasks. Remember that the percent complete assigned isn’t reflective of the actual work done or costs incured. Stakeholders need to understand the limitations of this method. There is a variation of the fixed formula method which is 0/100 percent: in other words, the task doesn’t ‘earn’ anything until it’s done. There is no progress or performance measure assigned to it. The work is either fully complete or not done at all. This is a good option to use for deliveries or where the deliverable is coming from a third party and being tracked outside of your project. For those tasks, the activity is either not finished, or done. For deliveries, for example, the materials are either on site or they aren’t. There isn’t much point in assigning progress when they are en route, as that doesn’t really get you any closer to the end goal. Fixed formula is a flexible way to think about performance measurement in earned value settings, but it’s also helpful for projects that are not using EV. Do you use percent complete or fixed formula? Or something else? In the next half of this article, I’ll talk about the other two methods: weighted milestones and physical measurement. See you then! Pin for later reading
|