
3 Barriers to Effective Benefits Management [Video]


|
Benefits realisation management is one of the hardest things to do in a project setting (in my opinion) and in this video I explain why. I talk about three things that make it harder and give you a few tips on what you can do instead to help get over some of the challenges. The three things are:
Watch the video below and then let me know whether you’ve seen any of these challenges in your organisation! There is more detail in this article: 5 Barriers to Effective Benefit Realisation that draws on information from Carlos Serra’s PMI presentation on the topic.
|

4 Ways to Measure Discrete Effort (Part 2)
Categories:
measuring performance
Categories: measuring performance
|
In Part 1 of this article I talked about two ways to measure discrete effort: percent complete and fixed formula. Today I’m going to share the other two options: weighted milestone and physical measurement. As a recap, discrete effort is the name given to the work required for an activity that can be planned, measured and ends up with something specific as the output. If you are doing work that directly leads to the completion of a deliverable, that’s discrete effort. There are different ways to measure this type of work in a project using earned value management, or even in projects that don’t apply EV measures but still need to track progress (like: all of them). I wouldn’t use discrete effort measurement techniques for every single task on every single project, but they are available to you if it makes sense to use them. This is the benefit of tailoring 😊 Weighted milestoneThe first one to look at today is weighted milestone. This is similar to fixed formula in that the value is apportioned to the work as the activity progresses, but it’s based on milestones. Divide the work package into measurable chunks that are attached to and end with milestones. For example, a work package might include a couple of weeks of design work before a document is created. There could be a milestone at the end of the last of a series of design workshops. When those milestones are reached, the activity earns the progress based on whatever breakdown you have assigned to each milestone. So how is this different to fixed formula? It’s different in that it suits longer term work packages. Fixed formula is best for short activities, those that don’t stretch over more than two reporting periods. Weighted milestone progress tracking is an option for when your work package runs longer than that. Ideally, each milestone should be a tangible ‘thing’ as well: some kind of interim result. Reporting works best when there is at least one milestone within each reporting period, otherwise you aren’t able to tell if work is on track as it won’t have moved since the last report. You don’t get credit for any deliverables leading up to milestones where the work isn’t completely finished. In other words, it’s the achievement of the milestone that triggers the tick in the box, not the progress against the tasks leading up to it. You don’t have to equally split the work across the different milestones. The ‘weighted’ part of this way of measuring progress allows you to apportion value across all the milestones. Allocate the appropriate amount per milestone, but don’t worry about limiting yourself to a regular split if that doesn't work for you. Physical measurementPhysical measurement is a way of tracking progress for things that can be counted. If you are working on something that has a specific, tangible way of measuring in a physical way, then this is the option for you. For example:
If you can measure it specifically in a real world way, then that becomes your measure. You should agree it in advance so everyone knows how the effort spent will be tracked and reported on. This is the easiest way to measure performance against a task, in my view. If the task is to landscape the gardens at 3 hotels, which totals 15 acres, of which you’ve done 3 acres, you get a pretty good idea of how much there still is to do. Stakeholders tend to understand this way of measuring straight away. You can also translate the measure into percent complete if you feel the need to represent it in that way. Do you use either of these two methods for tracking progess on your projects? If not, why haven’t you tried them yet? I think there is a certain ‘comfort blanket status’ that stakeholders attribute to percent complete as a way of monitoring performance against plan, but if we can get them away from that, then other options provide a different way (and often more realistic way) of measuring progress. |

5 Pitfalls of EVM
|
Or perhaps this article should be called: 5 pitfalls that can happen when EVM is not implemented the way it should be! Here are 5 things that can go wrong when an organisation chooses to implement Earned Value Management as a way of working for project performance tracking. 1. There is low organisational supportPossibly: there is no organisational support outside of the PMO. EVM is very much an enterprise-type solution so everyone needs to be on board. The whole organisation needs to know what it means for them as individuals and as a team – and you should try to bust the myth that it’s all complicated maths. In reality, most of the tools now do all the heavy lifting for you, so there’s no need to be hands on with the maths. However, the project delivery teams are going to need to understand the inputs and outputs to the formulas so they can interpret what the numbers are saying. That’s the secret: it’s making sure the wider team understands that the move to EVM is all about creating a set of essential measures to track performance and improve project control. 2. Thinking of EVM data as the answerEVM data is simply a representation of current project performance. It’s not a decision in itself. It’s not a set-in-stone forecast that tells you what is definitely going to happen. The team can still adapt and change, mixing up what they do to shape future performance, preferably in a positive way. The data should be seen as decision support information, helping the team make the right choices about what to do next in order to get the best results for the project. 3. There are poor or no decision-making processesPitfall #2 brings us on to this one: EVM implementations struggle when the organisation has poor (or no) decision-making processes. There should be some way of managing decisions as part of project control. Decisions and management responses to situations should be structured and repeatable, not knee-jerk. Proactive action taking is better than reactive ‘let’s just do something and cross our fingers’ type decisions. EVM data is good, and helpful, and informative but if the project leadership team don’t have the power or ability to do anything with it, then the data is just a set of pretty reports no one ever looks at. Decision makers should be looking for patterns, documenting decisions made and their outcomes so that future decisions can be shaped by today’s lessons learned and building credibility by using the information to improve project performance in meaningful, predictable ways. 4. Limiting EVM to a small groupWhen EVM is implemented, we talk about it being a whole enterprise thing, and that everyone needs to understand what it is and the value it brings to the organisation (as discussed in Pitfall #1 above). But making it ‘a whole enterprise thing’ actually goes far wider than a communication campaign. When EVM is implemented, it’s important that the whole team is able to see, input, act on and engage with EVM numbers. They should be responsible for their part of the system. In other words, it’s not a good idea to limit the people with hands on experience to a small sub-group of project practitioners in the organisation. It’s ineffective to ask project managers to provide time sheet information, for example, to the gatekeepers who then load it into the system and provide monthly reports in PDF format. That leads to a couple of problems. Practitioners feels like they aren’t truly included in the EVM and will probably disengage from it. For them, it becomes one more set of data points to submit to someone else for reporting; something that happens outside of their sphere of influence (or interest). It also creates a culture of auditing, where individuals feel that their work is dissected by people who lack hands on experience. EVM shouldn’t turn out to be a ‘them’ and ‘us’ experience in practice. For best results, it really does need to be a whole team process with plenty of input from everyone. Basically, it needs to become ‘how we do business round here’. 5. Not creating a common vocabularyOf all the various aspects of project management that require specialist jargon, is EVM the worst? I think it could be. There are all the acronyms (PV, EV, SPI, etc) and formulas. There are control accounts and control account managers (which must make control accounts very important if they have their own managers), plus the terminology that goes along with the WBS. The benefit of all this jargon is that when it is understood by everyone, it provides a common and clear way of talking about the same things. You avoid the misunderstanding of schedule vs plan, for example, because there is a common language with terminology that means the same thing to everyone. That’s powerful. It’s also good for decision making because clarity of understanding helps execs make the right call. Next month I’ll be looking at a few more pitfalls from EVM implementations that are not done in the best possible way, but meanwhile I’m interested in your views. What have you seen go wrong with EVM rollouts in the organisations where you have worked? Let us know in the comments!
|

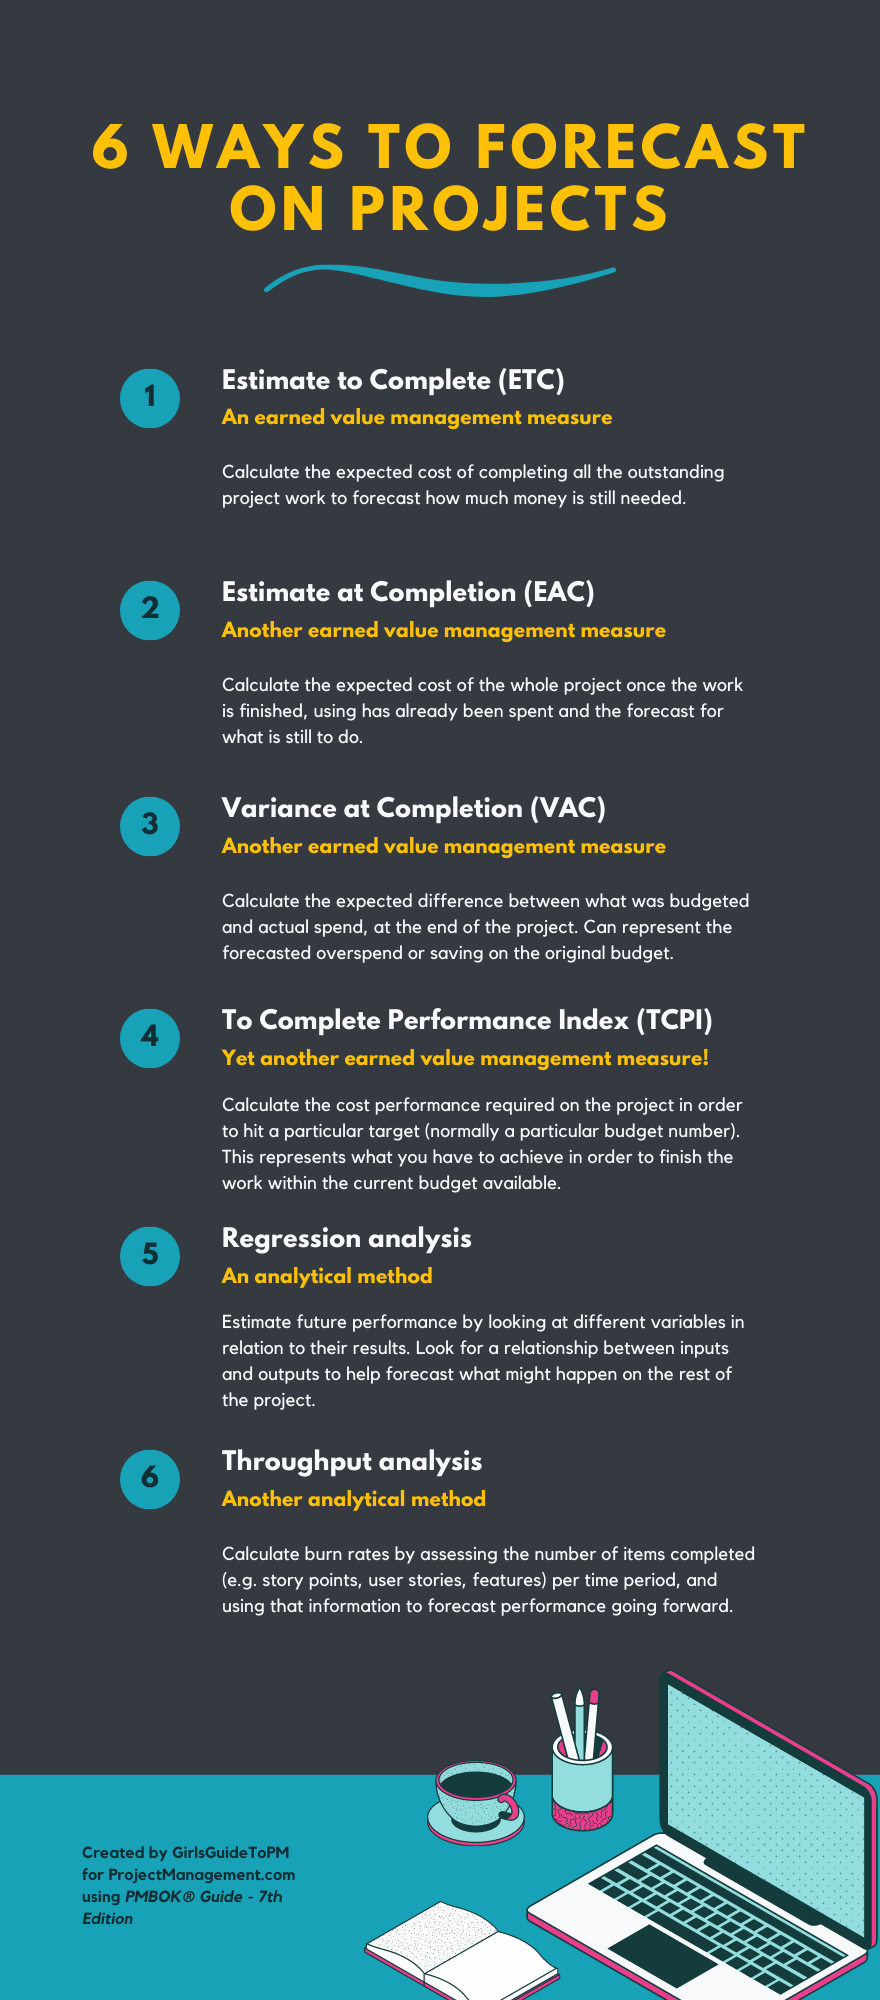
6 Ways to Forecast on Projects [Infographic]
| How to you predict what’s going to happen on your project, from the perspective of performance? The infographic below shows a few different metrics and performance measures that you can use to forecast future performance – helpful if you want to know what your project’s results might look like before the end of the project, so you can make better decisions about what to do and how to use your time and budget effectively. For more information about estimate to complete, estimate at completion, variance at completion and to-complete performance index, you can have a look at the PMI guidance on EVM and the ANSI Standard. Regression analysis and throughput analysis are other methods you could use. Infographics can only give a very headline view, so there’s a lot more to say about each of these! Which of these forecasting calculations do you use? Or do you forecast using something different?
|
5 Ways to Mitigate Risk [Video]
|
How do you actually go about mitigating risk? We talk about the need to mitigate all the time, but what kinds of things can you do to ensure that risks really are managed appropriately and mitigated to avoid the impact you think might be on the horizon? In this video, I talk about 5 different things you can try to mitigate risks. They are simple and practical, and you can easily turn them into solid actions for your risk log. If you want a couple of extra suggestions, and some more detail (or you just prefer to read rather than watch), then the original article that prompted this video is available here: 7 Ways to Mitigate Risk.
|
