19 Stories of Green


|
This blog post will let you share (and participate, in a fashion) in a tour I just took today of a landmark new building in Boston – the Data Sciences Building at 665 Commonwealth Avenue, Boston, on the campus of Boston University. Some numbers:
I was lucky enough to have a private tour for a small group of sustainability liaisons from BU’s individual Colleges, led by Dennis Carlberg, Adjunct Professor and Sustainability Director for BU. I will share some photos here and link you to a full album of pictures and a couple of short videos. One takeaway for project managers is that we, as agents of change, can push for innovative, sustainability-minded solutions based on benefits that show themselves in non-traditional ways and/or only after time has elapsed – and therefore are not measured very easily. Here’s one example from my tour. When the team decided early on to use geothermal heating and cooling for the building, one non-apparent (but HUGE) benefit was the amount of real-estate this made available in the building for use by students, faculty, and staff, that would have been otherwise taken up by gigantic heating and cooling units. 90% of these needs are taken care of by the geothermal system. Sure, the geothermal system involved pushing thirty-one 6-inch specialty tubes (see photo below of a model) into silt and bedrock, but the payoff is huge in the long-run.
Professor Carlberg showing a model of one of the 31 pipes used for the geothermal system. The real ones are 6 inches in diameter and go into the ground twice as long as the John Hancock Tower is high. And sure, it took extra effort to place green roofs all around in the space made available by the Jenga-like construction, but again, this makes the building more attractive and livable and assists greatly with the handling of rainwater.
(photo taken from the 5th floor of the building) (the plants are mostly sedum) Aside from the tremendous (and also measurable) benefits which this yields in terms of meeting BU’s Climate Action Plan, the fact that valuable Boston real estate is being more effectively used is a big deal and was considered in the project’s cost benefit analysis. Are these sorts of benefits – and is this sort of thinking considered in your projects’ cost-benefit equations? The tour was amazing – the building is amazing – as you can see from the photos and videos. I highly recommend that you take the tour yourself, and you can do it RIGHT NOW from the very device on which you are reading this blog post (unless that device is a piece of paper). Go here: https://www.bu.edu/sustainability/virtual-tour-ccds/ This will take you to a highly-interactive tour of the building and provide technical insight into how this became such a successful project. You will basically get a chance to see on your screen what I saw demonstrated on a gigantic touch-screen by Professor Carlberg (see photo below).
This is in the lobby of the building - the "Sustainability Wall" - a giant touchscreen. Experience it yourself RIGHT NOW by clicking here.
I suggest you visit at least the following (each only runs for a few seconds to a minute or so).
As project managers – or rather, project leaders, we have the chance to push for projects like this, or at a minimum to push the product owner, sponsor, and/or Senior Management to put in place thinking such as that which went into this amazing building. See an album of the pictures (see screen capture below) from my tour by clicking here.
You will get to see details and videos from the tour. Come visit! I hope you have a chance to visit the actual building at the campus of Boston University! |


Hot Boston: Part 1
|
Think about hot cities. Not 'hot' as in 'popular' or 'desirable' , or 'interesting. We're talking physically hot cities. What comes to mind? For me, I close my eyes and picture wavy heat lines coming up from the ground in places like Timbuktu, Mali, Kuwait City, Yuma, Arizona, Quito, Ecuador, Xi’an, China, or Cochin, India. Then I open my eyes, and see that Boston, Massachusetts is making news for developing a (say, what!?) Heat Plan. A heat plan? For Boston, Massachusetts? The one with the swan boats, snowstorms, and Fenway Paaahk? Climate change, believe it or not, real or not (it is), has real project consequences. Project managers will be taking the heat. Literally. Boston, Massachusetts is, in fact, already facing increasing temperatures not seen before, and is preparing to deal with it. The key word here, in fact, is “change”. It’s not that Boston is a particularly hot city. It’s that the change to a warmer climate is going to cause hardships, and more so for some communities than others. Boston is one of the cities with the highest rate of change in temperatures already under its belt and with one of the highest forecast increases - in the world. Project Managers as change agents are going to be needed to facilitate – better said, to lead - the response to that change - by adding resilience and solutions to deal with it - and with efforts to help reduce the change in the first place. This post is about the resilience-to-change part. In Boston, Mayor Michelle Wu (pictured below) has launched a program called Heat Resilience Solutions for Boston. Just that name itself is a bit (excuse the irony here) chilling.
Boston Mayor Michelle Wu
As a reminder, we are talking about climate change here. Not temperature changes by the hour, or day, or week – that’s WEATHER. Changes that accrue over time – years, or decades – that’s climate. The heat plan consists of 26 strategies, which we’ll of course approach from a Portfolio, Program, and Project management perspective in this blog. Here are the 26 strategies – categorized in to 5 … well, I will call them Program workstreams, which I’ll cover from an implementation perspective in future posts. 1. OPERATIONS AND COMMUNICATIONS 1.1 Boston Extreme Temperatures Response Task Force 1.2 Pre-heat-wave Resources Mobilization 1.3 Heat Sensor Networks 2. COOLING OFF DURING HEAT WAVES 2.1 Pop-up Heat Relief 2.2 Enhanced and Expanded 2.3 Citywide Cooling Network 3. LOOKING OUT FOR NEIGHBORS 3.1 Expanded Community Climate Leadership 3.2 Extreme Temperature Plans for Outdoor Workers 4. AWARENESS, EDUCATION, AND TRAINING 4.1 Heat Resilience Public Education Campaign 4.2 Heat Survey 4.3 Expansion of Green Workforce Development for Heat Resilience 5. BUILDINGS 5.1 Home Cooling Resources Distribution 5.2 Cool Roofs Program 5.3 Home Energy Retrofits 5.4 Affordable Housing Resources and Retrofits 5.5 Cool Schools 6. PARKS, TREES, AND OUTDOOR SPACES 6.1 Enhanced Cooling in Pocket Green Spaces and Street-to-Green Conversions 6.2 Increased Shade on Municipal Sites 6.3 Expanded Drinking Fountain Network 6.4 Planning for Future Parks 7. TRANSPORTATION AND INFRASTRUCTURE 7.1 Cool Commutes 7.2 Energy Resilience Upgrades and Microgrids 7.3 Cool Main Streets 8. PLANNING, ZONING, AND PERMITTING 8.1 Updated Climate Resiliency Checklist 8.2 Heat Resilience Best Practice Guidelines 8.3 Zoning Revisions to Support Cooler Neighborhoods
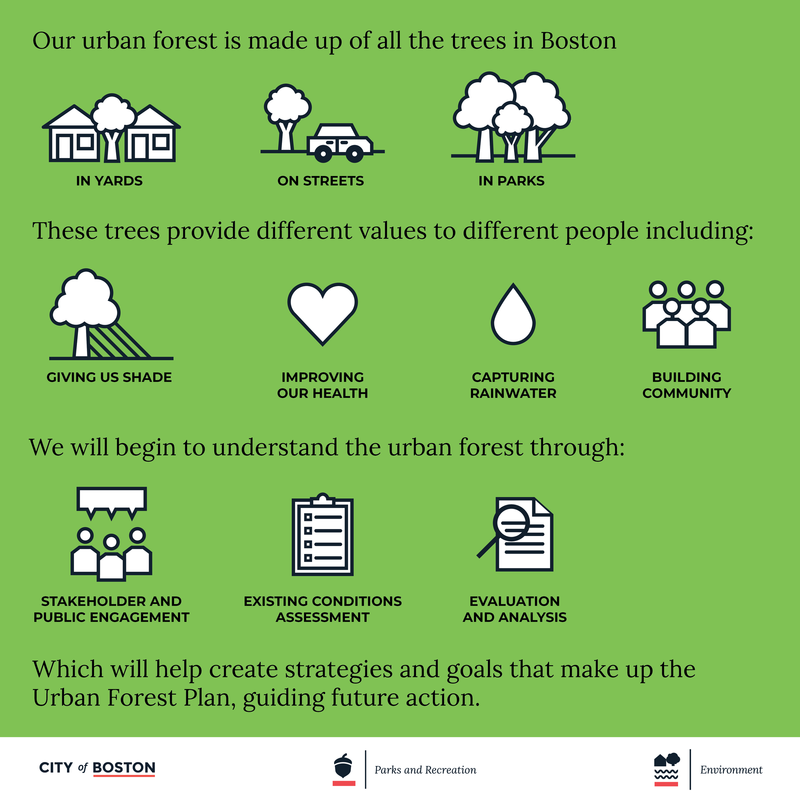
Interestingly, the plan is focused on environmental justice communities that are hotspots in Boston and experience greater burdens as temperatures increase: Chinatown, Dorchester, East Boston, Mattapan, and Roxbury. The heat plan is actually part of a larger Portfolio of programs I talk about in my classes, and have blogged about here, called Climate Ready Boston. The project management aspect of this initiative is gigantic. For example, as I teach in my courses at Boston University, Programs are all about related projects (and perhaps other programs). This heat plan (which I will call a Program) is intertwined with, and has dependencies on (amongst others), Boston’s Urban Forest Plan, which has as objectives to improve tree protection, stewardship, and new plantings for nature-based cooling solutions. Worthy of a blog post or two of its own (which it may soon get), the Urban Forest Plan is described well by this graphic:
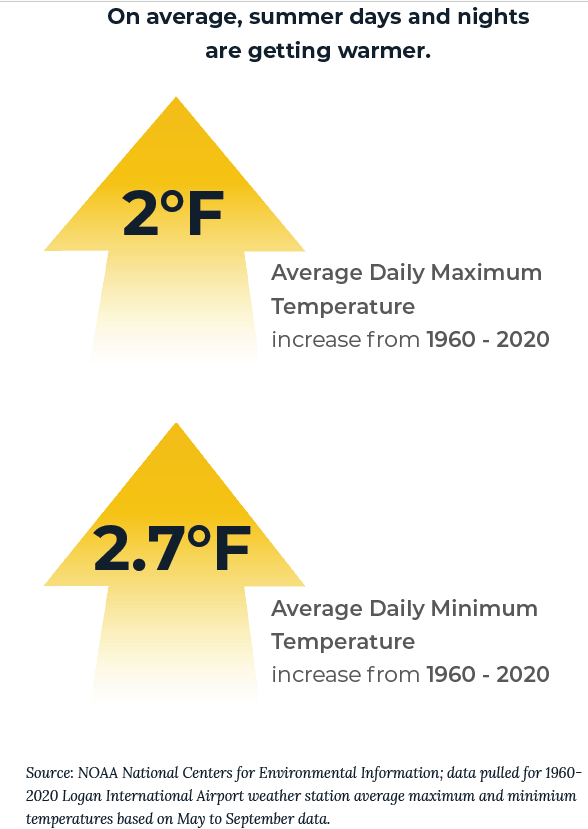
But let’s get back to the Heat Plan. The motivation – the rationale - for this is simple. Temperatures in Boston are rising. Again, not by the hour or the day, but over time. The Plan reference this NOAA data:
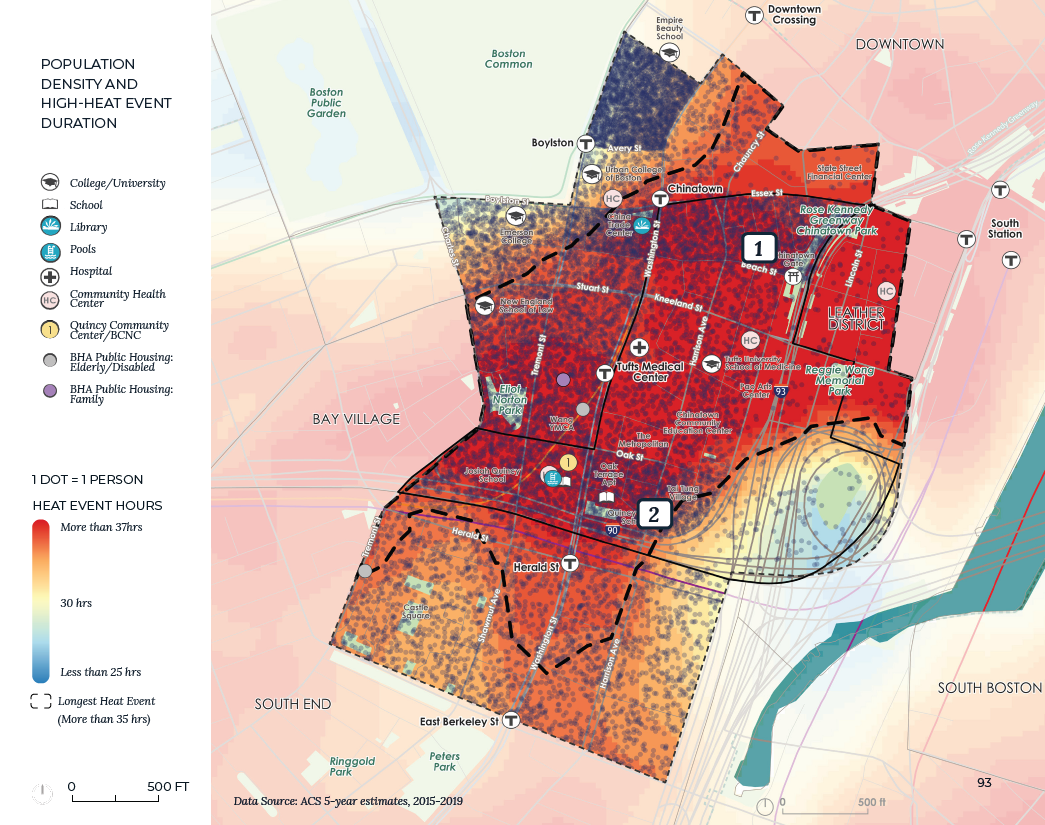
And the forecasts for 2070 are striking, making Boston's weather more like Atlanta or Miami by then. What is important here is not just “rising temperatures” but the effect on people, and indeed, the effect on people who are less able to deal with the heat due to their economic situation and living conditions. The image below is one of many in the report which provides scientific data that has been intelligently advanced into knowledge – this one showing population density and temperature levels, which shows the true concentration of problem areas and therefore the places that need the most attention from the program.
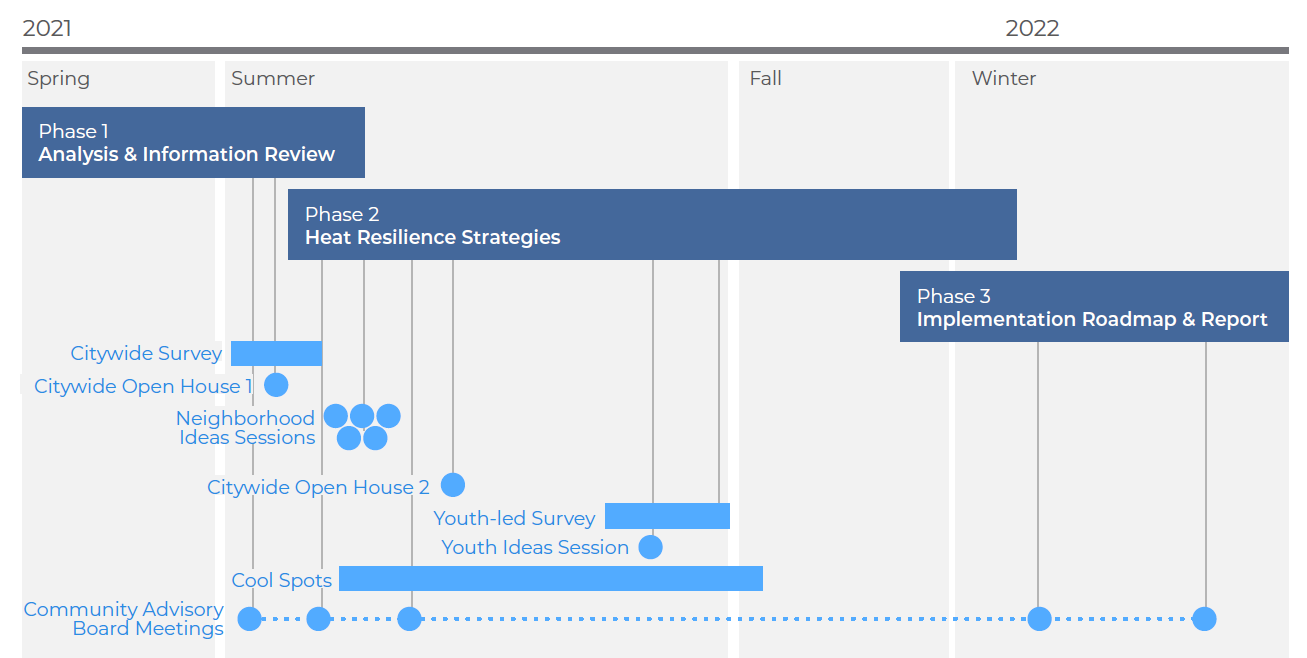
Like any good program, it starts with the vision of the Mayor’s office: Our mission is to provide executive leadership, as well as set priorities and goals for the City and its neighborhoods. And then gives a purpose to the Program itself (although it calls itself a project): We are preparing Boston for extreme heat and its impacts, both today and in the coming decades. The Heat Plan provides a citywide framework for heat resilience. Out work focuses on overburdened communities that will be most impacted by rising temperatures in Boston. The project to develop the Heat Plan was divided into three phases (this is sourced at the Heat Plan): PHASE 1: ANALYSIS AND EXISTING INFORMATION REVIEW The first phase included data gathering, review of previous and ongoing planning efforts, and developing a citywide heat analysis. This phase included two stages of extreme heat analysis: citywide and neighborhood-level patterns. The neighborhood-level analysis focused on Chinatown, Dorchester, East Boston, Mattapan, and Roxbury. The purpose of the neighborhood-level analysis was to evaluate how current day heat impacts vary across the city, identify temperature hot spots within environmental justice neighborhoods, and assess how racism, inequality, historic urban planning decisions, and other policies have influenced existing heat exposure and vulnerability. This phase also included the first community open house and the formation of the Community Advisory Board (CAB) to guide the planning process. PHASE 2: HEAT RESILIENCE STRATEGIES The second phase included drafting guiding principles for heat resilience based on community feedback from the first phase. The primary focus of the second phase was developing a series of draft strategies for heat resilience informed by findings from the citywide heat analysis and stakeholder and community perspectives. This phase explored considerations for heat resilience citywide and neighborhood specific applications of strategies within the five neighborhood focus areas. PHASE 3: IMPLEMENTATION ROADMAP AND FINAL REPORT The final phase of the project focused on refining the strategies, developing a benefit-cost analysis (BCA) for cooling homes, schools, and streets; creating a neighborhood-scale heat simulation to model the effectiveness of the physical heat reduction strategies; and developing an implementation roadmap. Here is the roadmap for the creation of the plan:
Note that the report is 351 pages. So far, all I’ve covered is the overarching program plan. In future posts, I will discuss their plan for stakeholder engagement and, of course, the all-important implementation roadmap. I admire the way that this team has structured the planning process and clarified the phases of planning with clear linkage to the purpose of the Program. I’d even suggest that students of Project, Program, and Portfolio management look at the Heat Plan as a good example. As mentioned, I’ll be continuing to review this initiative in future posts. The heat is on! |


Forest Gumption
|
Screenshot from the movie "Forest Gump" via YouTube
My last post – Project Managers – We're full of BS - promised a follow up, a second part called, Backward Pass, Forward Fail, and that is still forthcoming. However, in the meantime, and in the process of researching that post, an article in the June issue of PM Network caught my eye and deserves treatment immediately if only for its awesome title - which I have borrowed for this post. Full credit to the article - read it here. The story is about a very low-tech, and literally down-to-earth application of fighting climate change. And it’s as basic and old-school as planting trees, but with a fancier, more project-management name: reforestation initiatives. The United Kingdom launched a 500 million pound , 25-year project to plant 50 million trees in a large area of northern England. China’s government is launching a project in 2018 to plant trees covering a an area the size of Ireland, aiming to increase forested areas in China over 5% by 2030. And in Africa, a joint 21-nation program, seeks to cover almost 250 million acres with trees by 2030 – a $1B investment in fighting climate change with CO2-capturing trees. That’s equivalent to the total combined area of US states Minnesota, Kansas, Nebraska, Missouri, and Oklahoma! The initiatives also require public-private partnerships, like the Atlantic Forest Restoration Pact program in Brazil which will restore 2.5 million acres of tropical forest in Brazil. What’s important to note here is that these projects – of course – reap ecological benefits. Forests help absorb carbon dioxide, and provide wildlife habitats, but they also provide social and economic benefits. Assembling a coalition of stakeholders is key. In a partnership with the World Bank, for example, Conservation International worked with the Brazilian Ministry of Environment and other NGOs on a six-year project to plant 73 million trees by 2023. In doing so, the coalition of stakeholders hired indigenous community members and farmers to execute the project, bringing in as many as 2,000 local people to aid in the reforestation of each hectare. This generates jobs and income for the communities. Taking stock of the long term benefits from reforestation is an important element in reaching out to the various stakeholder groups. And yes, gaining this stakeholder engagement early on means a longer time between planning and execution - but it makes for a more sustainable sustainability project. It’s not all success stories, however, when it comes to planting trees. My own hometown, Boston, as recently reported in this Boston Globe story, is lagging other cities in keeping its promises with respect to planting trees. The photo of Boston’s iconic Citgo sign with a tree stump in the foreground, is representative of what you’ll find in the story.
Photo Credit: John Tlumacki, Boston Globe The story begins: A decade ago, Mayor Thomas M. Menino stood with other local officials in the Geneva Cliffs Urban Wild in Dorchester and vowed that Boston would plant 100,000 new trees by 2020, expanding the city’s tree canopy by 20 percent. With climate change a growing concern, cities across the country made similar pledges, a simple way to soak up carbon emissions and curb energy use, among many other benefits. That same year, New York City set an even loftier goal to plant 1 million trees by 2017. New York met its goal — two years early. Boston, however, has fallen woefully short. Not only has the city abandoned its goal for this decade, but it has barely kept up with tree mortality.
The article goes on to describe some or the reasons the project has failed so far – a mixture of mismanagement, lack of focus on the project objectives, and some realized threats, such as the amount of trees that have actually had to be removed based on such things as redevelopment projects and disease. It’s actually a good case for students of project risk management, I suggest reading it from that perspective. But it doesn’t take away from the overall thrust of the post – the focus on reforestation projects – mainly successful ones – and the contribution they have to offer in helping to provide long-term benefits of the social, ecological, and economic variety… in other words, People, Planet, and Profits. |