Smart Farming - Part 3a


|
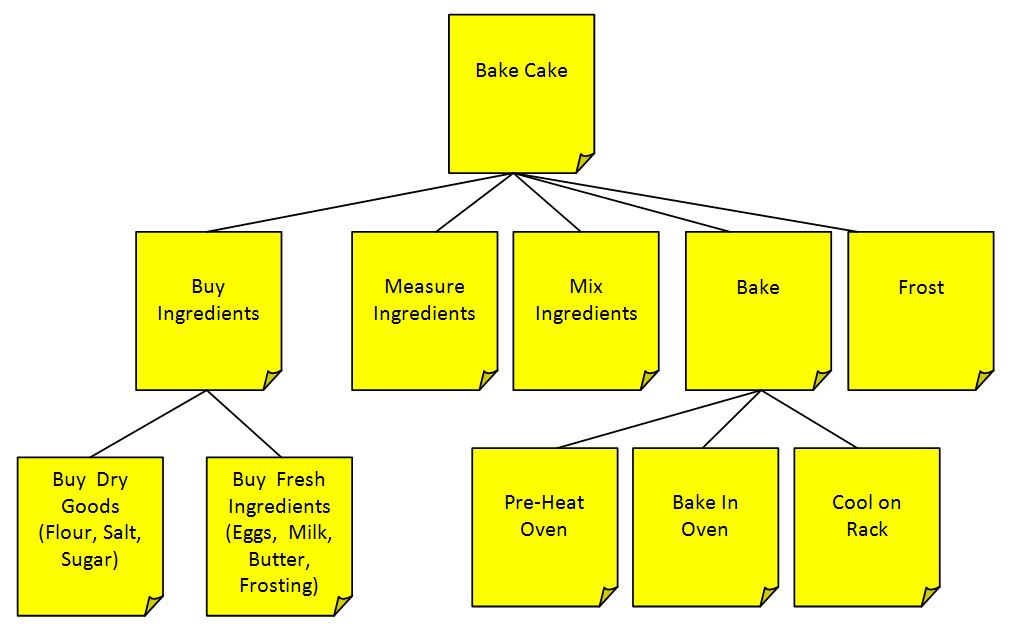
Image from https://www.successfuelformanagers.com/3-ways-develop-actionable-steps-project-planning/ Part 3 is the last (for now) in the series on Smart Farming - focusing on projects and programs in the area of growing and distributing foods. As I wrote it, I realized that it had to be further decomposed into Parts 3a and Part 3B. The decomposition theme continues here - in a WBS sort of way. Read on, brave project leaders, read on. In Part 1, I covered agrivoltaics - the practice of installing solar photovoltaic panels on farmland in a way that primary agricultural activities (such as animal grazing, insect resourcing (honey production) and crop/vegetable production) can continue. In Part 2, we shift upwards - WAY upwards, to focus on satellite imagery and using data to discover and potentially repair problems with topsoil. In Part 3, we bring our attention to the food that is grown on farms and projects surrounding its distribution. Again from UMass Magazine, there is a piece about Farm to Institution New England, a network backbone that connects farms to institutions, such as universities and hospitals. Their mission? "Our mission is to mobilize the power of New England institutions to transform our food system." A good mission statement deserves a vision that drives it. We know this as project (and especially Program and Portfolio) leaders. "By 2030, we envision New England institutions and the FINE network playing leadership roles in cultivating a region that is moving towards self-reliance. We envision an equitable and just food system that provides access to healthy and abundant food for all New Englanders, and is defined by sustainable and productive land and ocean ecosystems."This is a project-oriented organization. For a glimpse at some of their work, visit their projects page by clicking here. I was fascinated by the projects surrounding University dining. As a long-ago graduate of UMass Amherst, I am of course proud of the UMass year-after-year number one ranking for campus food (very, very different from when I attended - can you say "cube steak"?). FINE has published (amongst many other items) this interesting report about the supply chain of food from local farms to university campuses, called Campus Dining 201 (click on the link or the image below for an immediate download).
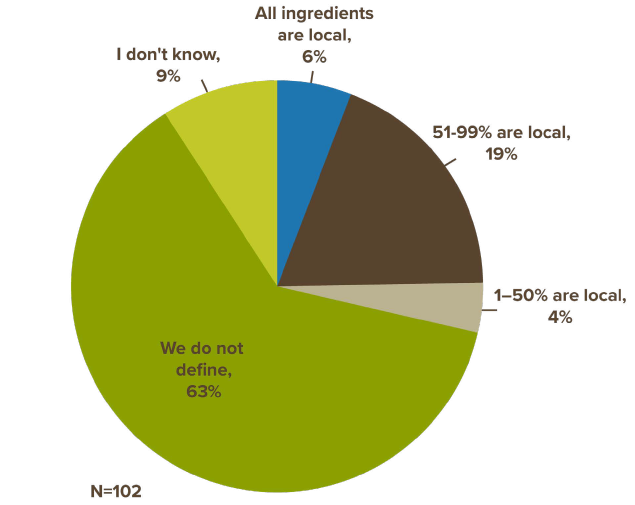
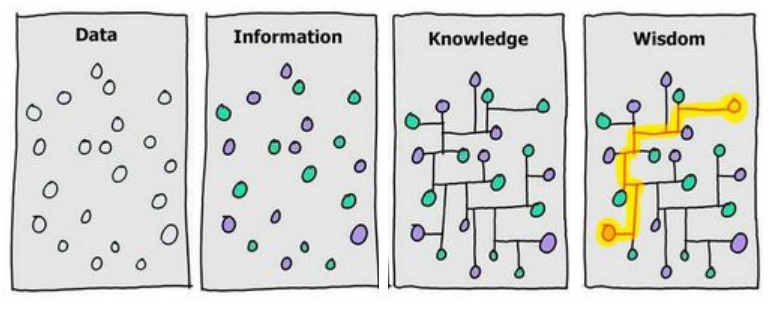
In it, you will find a treasure trove of data (D) advanced into information (I) and knowledge (K), providing wisdom (W) (see the Part 2 post of this series to learn about the DIKW Pyramid). Amongst the gems in this report, and of particular interest to project leaders, is the pie chart (see figure below) which talks about the definition of "local food". We know that in a Work Breakdown Structure (WBS), we need a WBS Dictionary to tell us what we mean when we say (for example) "Complete Electrical Wiring", and whether or not that includes installation of light fixtures. It's similar to the idea of defining project success, so that we know when we're done - but on a work package level. To even begin to understand the food supply chain and the element of 'local food', what do we mean by the term 'local food'? The pie chart below tells us that we have some work to do in that area:
I was amazed by the fact that almost 3/4 of the schools don't define or know what is meant by local food. So it seems some work is in order to provide the equivalent of a WBS Dictionary for terms such as this. Otherwise we are in danger of compiling lots of data and creating lovely charts that are based on undefined or unknown inputs - a formula for disaster. Work being done by groups such as FINE are helping us avert this disaster by providing some definition. Do your projects have concise and clear definition around the work to be done? It's worth some background work on your part as a project leader. In Part 3b, I'll close out this series with more about projects focused on the food supply chain and advancing data into information, knowledge, and wisdom in the area of just how that Christmas fruitcake from Auntie Catherine made it from ... wherever fruitcakes come from ... to your holiday table.
Merry Christmas!
|

Smart Farming Part 2
|
Cloud Ag visualization showing variable soil carbon levels across a single field. Image credit: Cloud AgCloud This is the second in a series on Smart Farming; this one focusing on things way above the Earth and well, the earth of the Earth. This is a post about how technology projects can be applied to increasingly important sustainability issues of all sorts, including, literally the soil under our feet. It’s also a post about collaboration, combining different disciplines, and listening to stakeholders, all important principles of the 7th Edition PMBOK® Guide. I open with a quote from the article from UMass Magazine. A few years ago, (UMass) geosciences Assistant Professor Isaac Larsen was driving along in the Midwest, near where he grew up. “The hilltops in the landscape no longer had organic rich soil—just subsoil. I could tell by the color,” he recalls. A big driver of soil erosion and degradation is the plow. “Every time a plow goes across the landscape, it fluffs up the soil,” Larsen explains, "and the soil moves down the slope.” Over the course of a century and a half, that’s a lot of soil. What to do? Supported by NASA, Larsen and his team are utilizing satellite imagery to analyze the problem. “We can relate soil color that we see in satellite imagery to the amount of carbon in the soil, and then relate that amount of carbon to a soil horizon,”—or soil layer—explains Evan Thaler, a doctoral student working with Larsen. The team has been able to show that around a third of all cultivated land in the United States has lost its rich topsoil. “The next step,” says Thaler, “is for policy makers to incorporate this information. If we can rebuild the carbon in the hilltops, we’re actually pulling carbon dioxide out of the atmosphere and putting it back in the soil, so it’s absolutely a climate change issue as well.” Larsen backs that up. “We have to mitigate the effect we’ve had,” he says. “Restoration of carbon to soils is one piece of the solution.” So, this project was about applying satellite technology and business intelligence (BI) to collate and advance data into information, into knowledge, providing wisdom – a key theme for project managers. If you are not familiar with the DIKW pyramid, today is the day you should investigate it. You can start with this excellent article (Click here to read an outstanding article on the topic).
I found this theme reiterated in several diverse sources. In this article from NPR, Evan Thaler is quoted again: The soil that's darkest in color is widely known as topsoil. Soil scientists call this layer the "A-horizon." It's the "black, organic, rich soil that's really good for growing crops," says Evan Thaler, a Ph.D. student at the University of Massachusetts, Amherst. It's full of living microorganisms and decaying plant roots, also called organic carbon. When settlers first arrived in the Midwest, it was everywhere, created from centuries of accumulated prairie grass. Plowing, though, released much of the trapped carbon, and topsoil was also lost to wind and water erosion. The soil that remains is often much lighter in color.
It's clear that this is important, but even more so when you note the connection to climate change, this gets even more interesting. I found this article in a site dedicated to applying Artificial Intelligence to practical matters – in this case, soil carbon monitoring, the very topic of this Smart Farming post. In short, it describes how soil systems (healthy ones, that is!) act as a carbon “sink” by sequestering atmospheric CO2, thus reducing greenhouse gas concentrations. Healthy soil, says the article, is capable of storing twice the amount of carbon in the atmosphere and three times that in above-ground vegetation. The article answers the question: “why initiate projects to carefully measure soil carbon? Why should we monitor soil carbon:
Ironically, this post about the Earth’s soil provides some help for project managers who want to ‘build from the ground up’ in terms of advancing data into information, knowledge, and wisdom.
For more digging (pun intended): “Soil organic carbon and carbon sequestration in Western Australia” “Extent of Soil Loss Across the US Corn Belt” https://www.pnas.org/content/118/8/e1922375118 “Quantifying carbon for agricultural soil management: from the current status toward a global soil information system” https://www.tandfonline.com/doi/full/10.1080/17583004.2019.1633231 Davis, et al , “Review of Soil Organic Carbon Measurement Protocols: A U.S. and Brazil Comparison and Recommendation” |


Smart Farming Part 1
|
OK folks, time to add a new word to your vocabulary: Agrivoltaics. This refers to the practice of installing solar photovoltaic panels on farmland in a way that primary agricultural activities (such as animal grazing, insect resourcing (honey production) and crop/vegetable production) can continue. It’s also called dual-use solar. A recent article in UMass Magazine features several stories in one article; this post focuses on the first story, regarding (you guessed it) Agrivoltaics. A portion of the article reads: Dwayne Breger ’94PhD, director of the UMass Clean Energy Extension, says, “With dual-use solar, you do simultaneous solar collection and farming on the same land, together.” In theory, placing solar panels higher off the ground and spacing them farther apart allows the sun to hit both the panels and the plants sufficiently. In the mid-2000s, UMass installed one of the first dual-use arrays in an experimental farm in South Deerfield to test the theory. Now, Breger’s team is working with three solar developers on eight different farms. “These site trials will greatly expand the data,” Breger says. “You’ll see active agriculture taking place under the array. It could be row crops or a field of hay or sheep grazing,” Breger says. “Raising the panels helps distribute the shading, and also allows farm machinery to get under and around them.” Fine-tuning dual-use farming can provide farmers with another revenue stream and more solar power for the rest of us. “We’re rooting for clean energy, and we’re rooting for farming and food.” This short article inspired me to dig deeper and it led to a whole series of interesting findings.
An opportunity becomes a threat, becomes an opportunity again One of the findings is related to project risk. We all know that when we respond to a threat, there is a chance of secondary risk – that is, new threats (or perhaps even new opportunities) arising because of the threat response. An example is an injury incurred from an air bag deployment. The air bag is a threat response to injuries from impacts in auto accidents, and if the airbag itself causes injury – that’s a secondary threat. In the case of solar farms, they are a response to the threat of climate change (and an opportunity to make money as a power-generation mechanism). However, when they are installed, vast amounts of farmland could become unavailable – thus, a secondary risk of the solar farm deployment. In fact, farm and ranch lands are often the ‘victim’ of urban and highly developed land use, some of which is solar farm use. From the farmlandinfo website: “between 2001 and 2016, 11 million acres of farmland and ranchland were converted to urban and highly developed land use (4.1 million acres) or low-density residential land use (nearly 7 million acres).” The reports on the site also show how states have—or have not—responded to the threats of agricultural land conversion. This is a good source of information on the topic if it has piqued your interest. You can visit:
https://farmlandinfo.org/publications/farms-under-threat-the-state-of-the-states/
https://farmlandinfo.org/media/co-location-of-agriculture-and-solar/ An example of the loss of agricultural land is shown below. Interactive maps of every US state are available here. This one is from northeastern Massachusetts. Red dots indicate loss of agricultural land
Continuing to dig into this after being inspired, I found a quite resource-rich US Department of Energy site covering (ironically) its aptly-named INSpire project.
New research demonstrates that states and regions can more than meet their ambitious solar energy goals on marginal and developed land without sacrificing its productive farmland and sensitive wildlife habitat. Examples of interesting projects described in Inspire include:
I recommend visiting the US Department of Energy Inspire site: https://openei.org/wiki/InSPIRE/Project You will find there:
References Overall (inspirational) source: https://www.umass.edu/magazine/fall-2021/smartfarm Other references: https://ag.umass.edu/clean-energy
|


Animal Intelligence: Part 2 of 2 - Winging It!
|
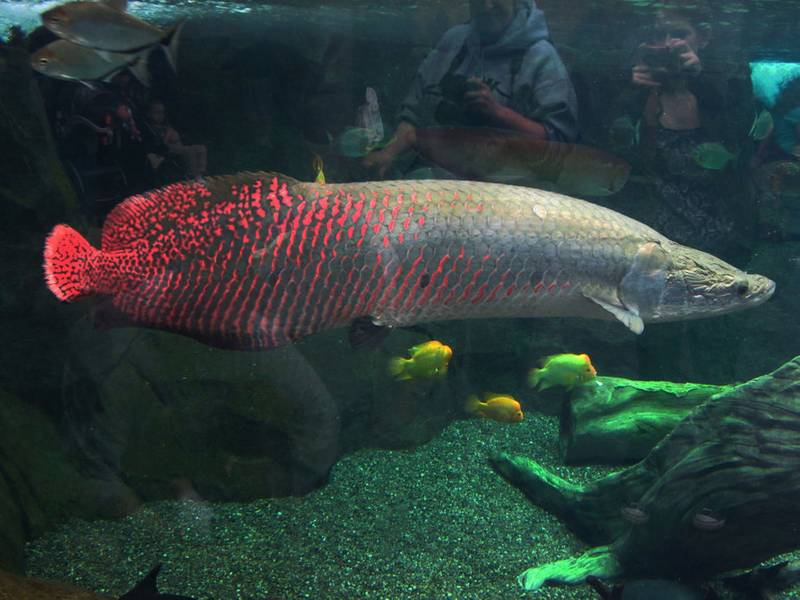
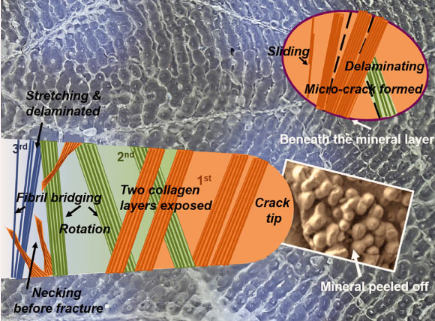
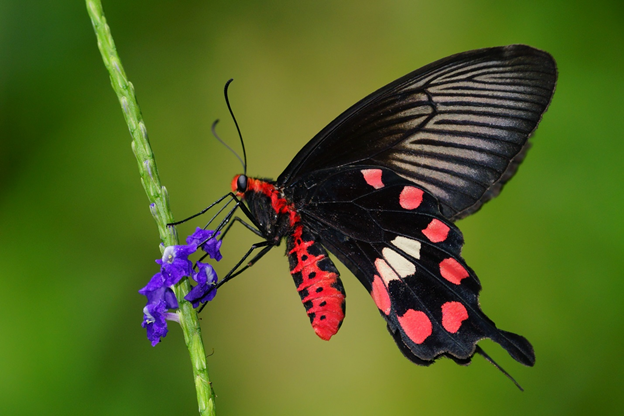
In Part 1 of this series, I discussed the giant Arapaima fish which is inspiring better designs for body armor. In this episode, we leap from the fresh waters of the Amazon and other parts of the world to the skies of southern and southeast Asia, to learn about how butterflies are providing their own source of inspiration. In the BBC podcast series “30 Animals That Made us Smarter”, butterflies are (so far) featured not once, but three times. The first two:
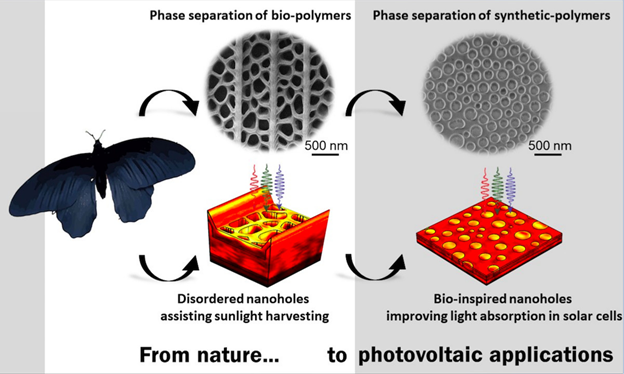
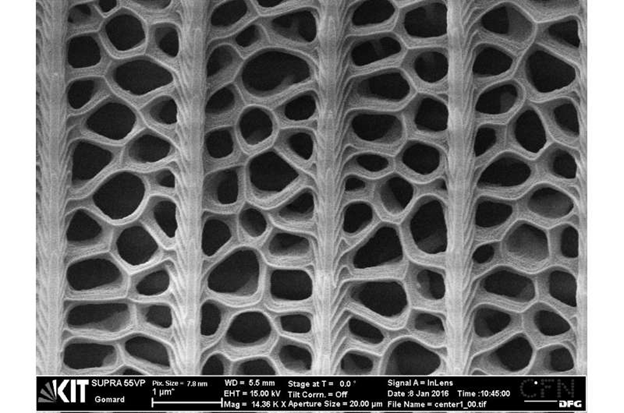
This episode, however, is about biomimicry threaded through a project to significantly improve solar panel efficiency thanks to the Common Rose butterfly, featured in the top photo in the blog post. So - what’s the story here? Butterflies have no way to generate heat internally – they are cold-blooded. They are constantly ‘harvesting’ solar energy – it’s a heat tactic to warm up their internal temperature. California Institute of Technology scientist Radwanul Hasan Siddique explains, in the paper, “Bioinspired phase-separated disordered nanostructures for thin photovoltaic absorber”, “The nanopatterned absorbers achieve a relative integrated absorption increase of 90% at a normal incident angle of light to as high as 200% at large incident angles, demonstrating the potential of black butterfly structures for light-harvesting purposes in thin-film solar cells.” This team was able to create the structure organically – creating plastics which naturally organize itself into a lattice structure. Doubled the amount of light collection, especially at “off angles” or indirect sunlight. Below you can see figures depicting the process, and a closeup of the structure – something that is not an ‘obvious engineering solution’ – something we’re taught about from …butterflies:
Could your project use some bio-inspiration? Check out the podcast, 30 Animals That Made Us Smarter!
Overall source: R.H. Siddique el al., "Bioinspired phase-separated disordered nanostructures for thin photovoltaic absorbers," Science Advances (2017). advances.sciencemag.org/content/3/10/e1700232 Other references: https://phys.org/news/2017-10-black-butterfly-wings-solar-cells.html |
Animal Intelligence: Part 1 of 2 - The Arapaima
| |